Figure 7.
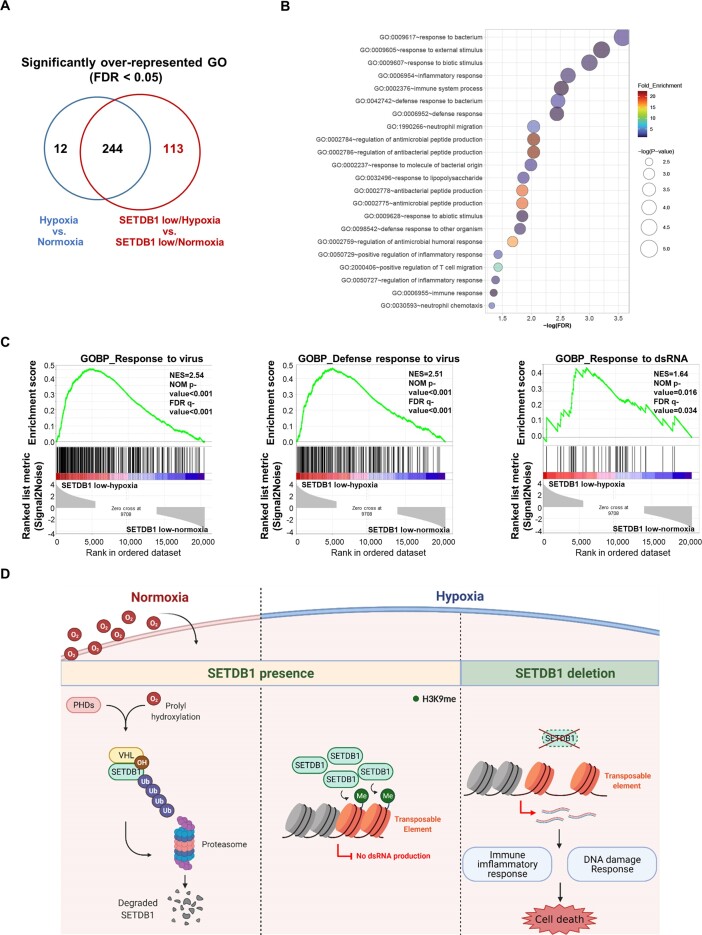
Transcriptomic profiling using patient data from the Pan-Cancer Atlas. (A) Venn diagram showing the number of differentially represented GO pathways across hypoxia versus normoxia, hypoxia with low SETDB1 expression versus normoxia with low SETDB1 expression and overlap between each set of groups. (B) Enriched GO pathways in the hypoxia with low-SETDB1 group. The size of the circles is consistent with –log (P value). (C) Representative enrichment plots from GSEA conducted for SETDB1 low-hypoxia versus SETDB1 low-normoxia groups. NES (normalized enrichment score), the normalized P values and FDR values are described. (D) Schematic illustration for oxygen-dependent regulation of SETDB1 function, generated with BioRender (http://biorender.com). In normoxia, PHDs hydroxylate proline residues of SETDB1 for VHL-mediated polyubiquitination followed by proteasomal degradation (left). In hypoxia, unhydroxylated SETDB1 is stabilized by escaping from VHL-mediated degradation. Increased SETDB1 leads to augmented SETDB1 occupancy at chromatin associated with TEs and subsequent strong repression of TEs via H3K9 methylation (middle). SETDB1 loss in hypoxia fails to silence TEs, thereby generating TE transcript-derived immune-inflammatory and DNA damage responses, with subsequent cell death (right).

