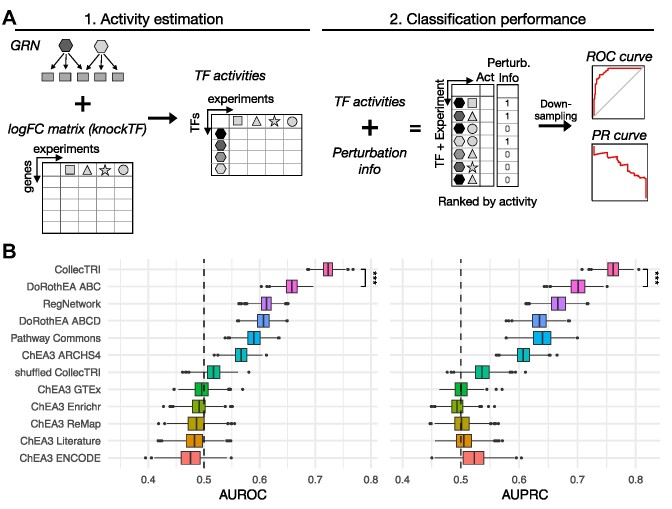
Figure 2.
Systematic comparison of collections of transcription factor (TF) regulons. (A) Description of benchmark pipeline for the comparison of different regulon collections. First, transcription factor (TF) activities are inferred from the gene expression data of the knockTF perturbation experiments using the regulon information from each resource. TFs are presented as differently colored hexagons and experiments are presented as different shapes. Activities are then aggregated across experiments and ranked by their activity. A downsampling strategy is applied to have an equal number of perturbed and non-perturbed TFs randomly selected 1000 times to calculate area under the Receiver operating characteristic (AUROC) and Precision–Recall curve metrics (AUPRC). (B) Predictive performance of TF regulons identifying perturbed TFs in knockTF experiments. AUROC (left) and AUPRC (right) for each regulon collection classifying TFs as perturbed or non-perturbed based on their activities.

