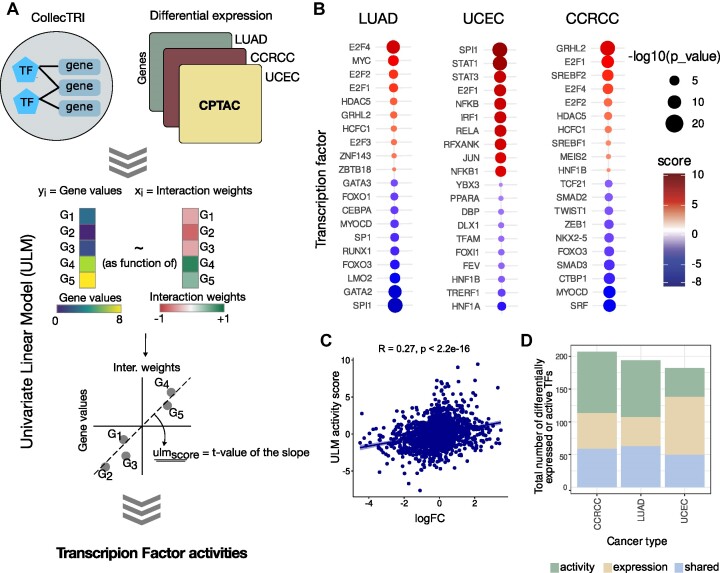
Figure 3.
Workflow and results of the case study of transcription factor activity inference using CollecTRI and decoupleR. (A) Schematic representation of the workflow for the inference of transcription factor activities from transcriptomics data of Uterine Corpus Endometrial Carcinoma (UCEC), Lung Adenocarcinoma (LUAD) and Clear Cell Renal Cell Carcinoma (CCRCC). (B) Transcription factors (TFs) with differential activities as predicted by decoupleR. Each TF is shown as an individual dot and colored based on the inferred activity score. The size of the dot is inversely related to the P-value (the bigger the size, the more significant the observation). (C) Correlation between predicted activity of a TF (y-axis) and the logarithmic fold change (logFC) compared to normal tissue (x-axis). (D) Overview of the number of TFs identified from expression (beige), activity (green) or both (lightblue).

