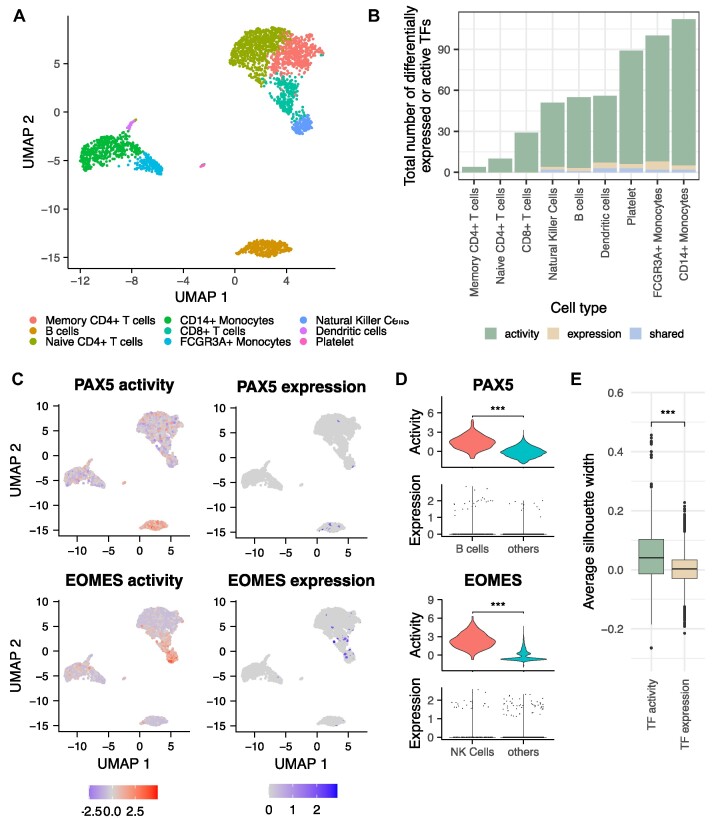
Figure 4.
Application of TF activity estimation using CollecTRI on a representative scRNA-seq dataset of peripheral blood mononuclear cells (PBMCs). (A) UMAP of scRNA-seq data of PBMCs (n = 2638), color corresponds to annotated cell types. (B) Overview of the number of marker TFs identified from expression (beige), activity (green) or both (lightblue). (C) UMAP of scRNA-seq data of PBMCs showing the activity (top) or expression (bottom) levels of the TFs PAX5 (left) or EOMES (right). TF activities were estimated for each cell using the CollecTRI-derived regulons and the univariate linear model method in decoupler. (D) TF activity and expression for PAX5 (top) and EOMES (bottom). The expression and activity of PAX5 and EOMES were compared between the corresponding cell type (B cells for PAX5 and natural killer (NK) cells for EOMES) and all other cell types. For the expression of both TFs, statistical testing was not applied as their expression was captured in less than 15% of cells in the corresponding cell type. (E) Comparison of cluster correspondence to annotated cell types from TF activity and TF expression through the average silhouette width of all cells.

