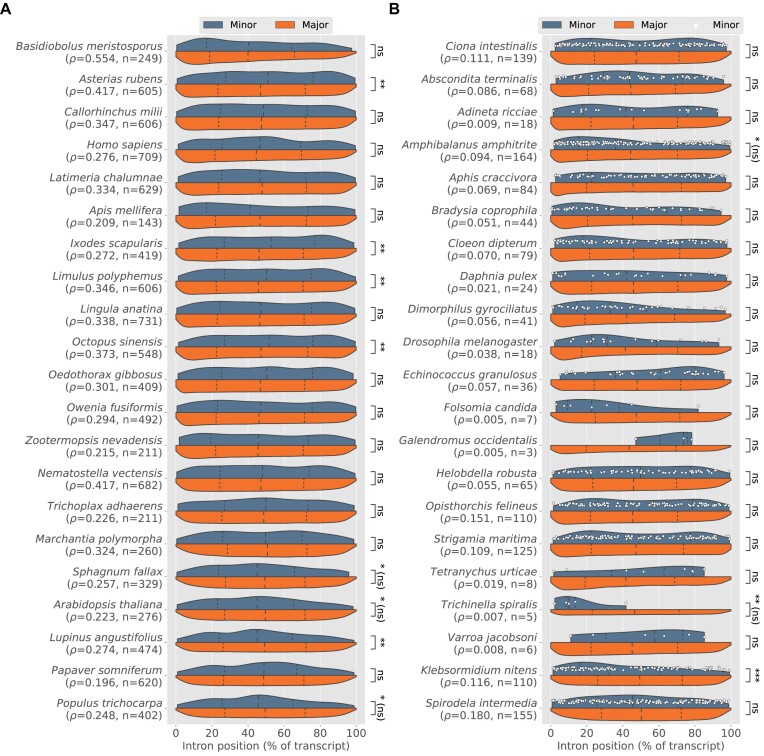
Figure 4.
Intron position distributions for major (red) and minor (yellow) introns in selected species. (A) Species enriched in minor introns. (B) Species with significant inferred minor intron loss; white dots represent individual minor introns. For both plots: Dashed lines represent the first, second and third quartiles of each distribution; ρ indicates minor intron density; n is number of minor introns; statistically significant differences between minor and major introns are indicated with asterisks (two-tailed Mann–Whitney U test; *P ≤ 0.05; **P ≤ 0.001; ***P ≤ 0.0001; "ns" not significant; asterisks followed by "(ns)" indicate statistical significance assignments that did not survive correction for multiple testing under Benjamini–Hochberg). Note that in some cases of significant difference between the two intron types, e.g. within animals, it is the major introns with greater 5′ bias.

