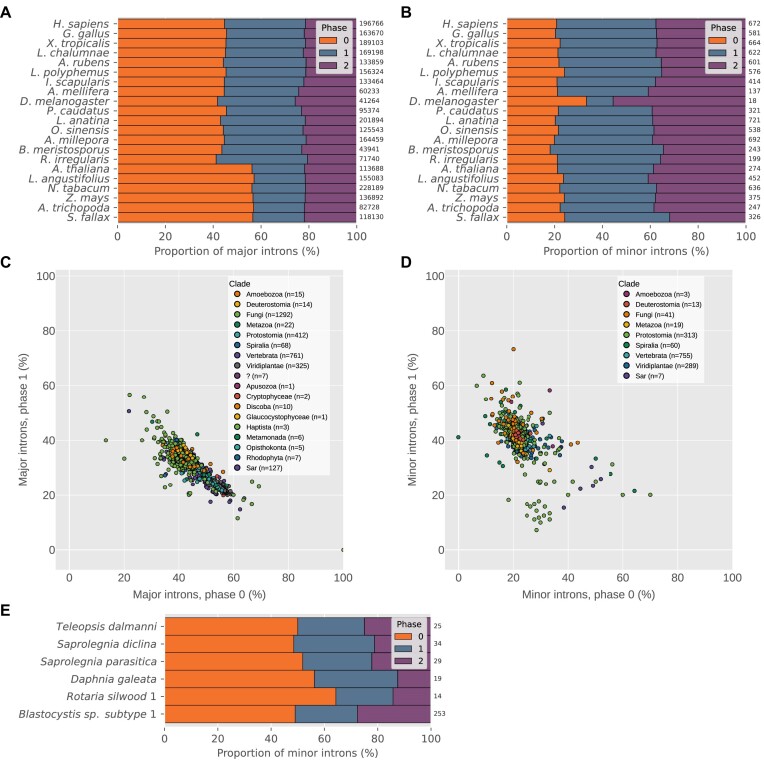
Figure 5.
Minor and major intron phase biases. (A,B) Phase distributions of major and minor introns, respectively, in various species. Numbers at the ends of bars represent the total number of constituent introns. (C) Proportions of phase 1 (y-axis) versus phase 0 (x-axis) major introns. Correlation of phase 0 to phase 1 ρs = −0.81, p ≪ 0.0001. (D) Proportions of phase 1 (y-axis) versus phase 0 (x-axis) minor introns in species with at least 10 high-confidence minor introns. Correlation of phase 0 to phase 1 ρs = −0.48, p ≪ 0.0001. (E) Unusually high proportions of phase 0 minor introns in certain species (graphical elements as in (A) and (B)). Proportions of phase 0 minor introns for all species are significantly different from expected values derived from the proportion of phase 0 minor introns in human (phase 0 versus sum of other phases, Boschloo’s exact test P < 0.05). Species in (C) and (D) with fewer than 10 identified introns of the corresponding type were excluded, as were species in (D) with uncertain/borderline minor intron presence (see Curation of minor intron data/edge cases).

