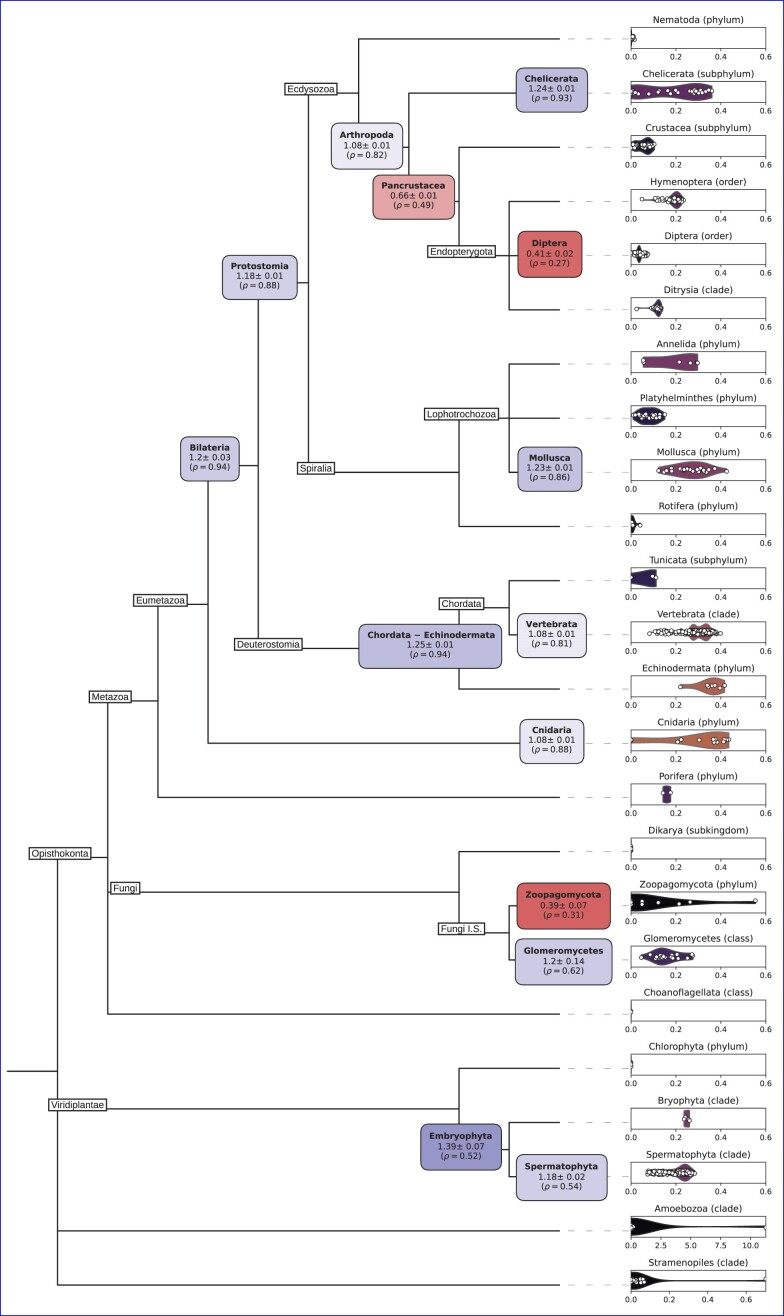
Figure 8.
Minor intron density distributions in selected clades, and ancestral reconstructions of minor intron densities at selected nodes. Ancestral density node label color indicates enrichment (blue) or reduction (red) relative to the reference species in the alignments; the first number underneath each node label is the average estimated minor intron density at that node as a fraction of the reference species’ minor intron density; ρ indicates the node’s average estimated ancestral minor intron density. For animals, the reference species is Homo sapiens; for plants, Lupinus angustifolius; for fungi, Rhizophagus irregularis. Terminal violin plots show the distribution of minor intron densities (percent of all introns classified as minor) in extant lineages of the labeled taxonomic group.

