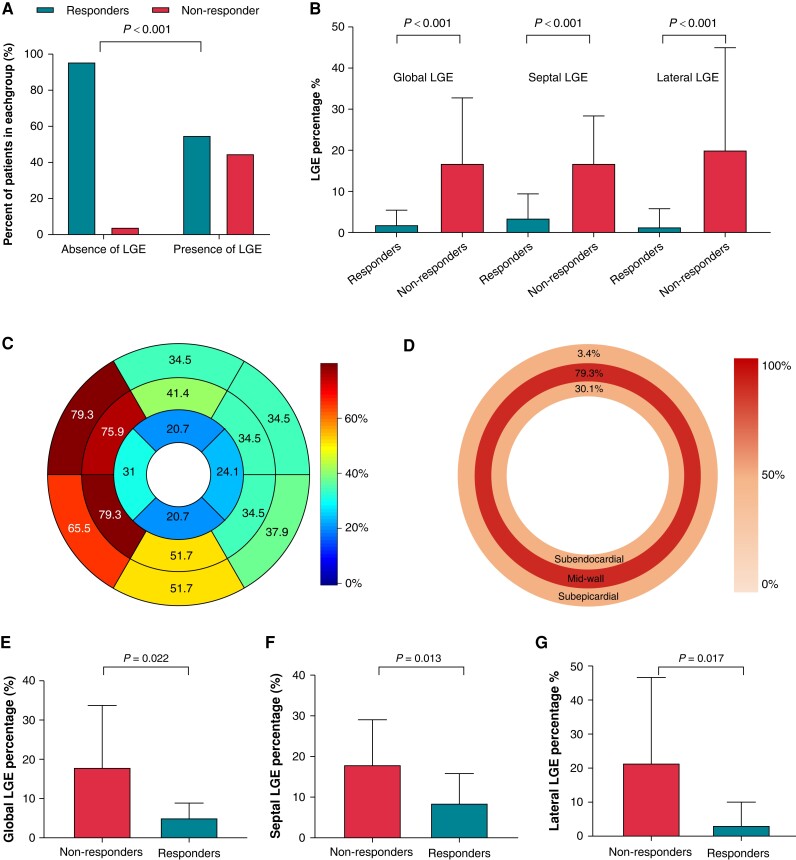
Figure 1.
Cardiovascular magnetic resonance–derived scar features and comparison according to echocardiographic response. (A) Presence of myocardial scar in relation to echocardiographic response. (B) Global, septal, and lateral scar extent according to echocardiographic response in all patients. Barplot depicts mean with standard deviation. (C) Distribution of scar among patients with presence of LGE according to the AHA 17 segment. (D) Distribution of scar in subendocardial (inner circle), mid-wall (middle circle), and subepicardial layers (outer circle). (E–G) Comparison of global, septal, and lateral scar percentage between responders and non-responders in patients with LGE presence. Barplot depicts mean with standard deviation. LGE, late gadolinium enhancement.

