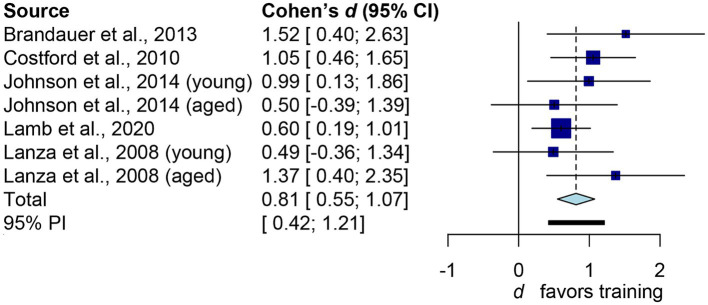
Figure 3.
Forest plot of human’s iNAMPT expression following exercise training. The squares represent the results of independent datasets, with the size of each square proportional to the dataset’s weight. The horizontal line represents the 95% confidence interval. The diamond represents the pooled result. The bold horizontal line represents the 95% predictions.

