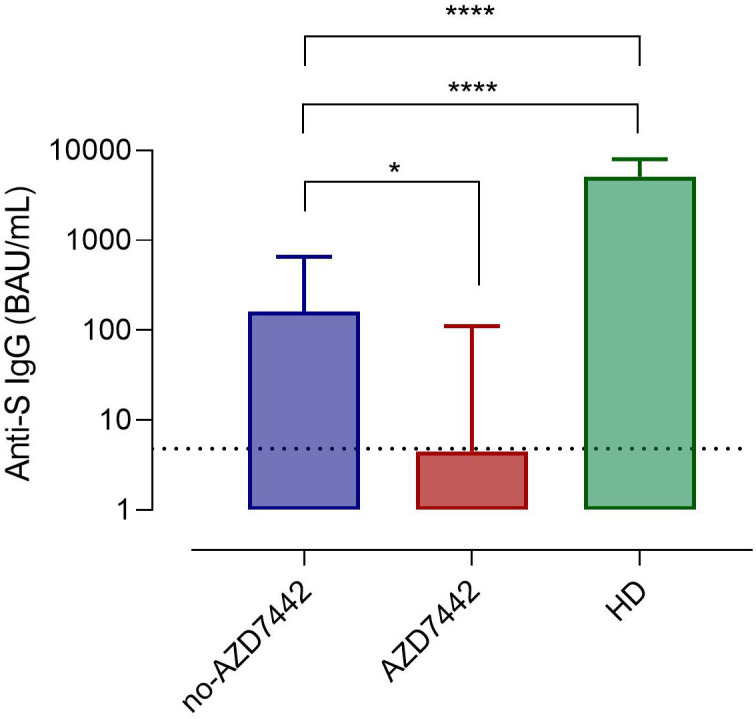
Figure 2.

Anti-Spike IgG serum levels in patients in the AZD7442 group (red), in those in the no-AZD7442 group (blue) and in healthy controls (green). Bars indicate the median. The lower detection limit of the assay is represented by the dashed line. Non-parametric Mann–Whitney t-test was used to evaluate the statistical significance. Two-tailed P value significance is shown as * p<0.05, ****p<0.0001. anti-S IgG, anti-Spilke protein immunoglobulin G; BAU, binding antibody unit; HD, healthy controls.
