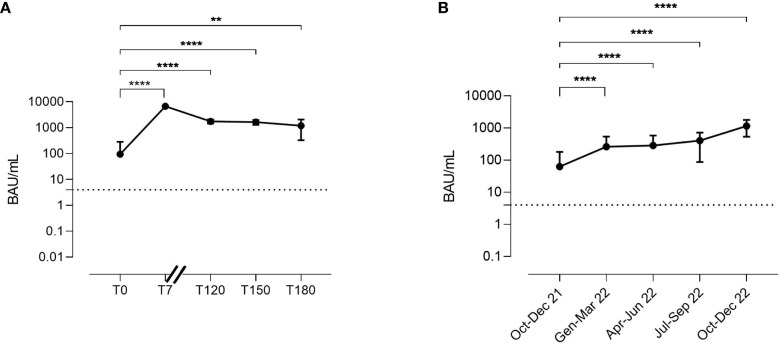
Figure 4.
Kinetics of anti-Spike IgG serum levels in the AZD7442 recipients (A). Anti-Spike IgG serum levels in patients under IgRT over time (B). Anti-Spike IgG was randomly measured over 15 months in plasma samples collected from patients just before intravenous administration. The lower and the upper detection limits of the assay are represented by the dashed line. Points indicate medians, bars indicate interquartile ranges. Non-parametric Mann–Whitney t-test calculated by the first and the following time points was used to evaluate the statistical significance. Two-tailed P value significance is shown as ** p<0.01 and ****p<0.0001. Number of samples tested: (A), T0 n=30, T7 n=30, T120 n=25; T150 n=15, T180 n=8; (B), Oct-Dec 21 n=53; Jen-Mar 22 n=35, Apr-Jun 22 n=15, Oct-Dec 22 n=22. BAU, binding antibody unit; T, time point.

