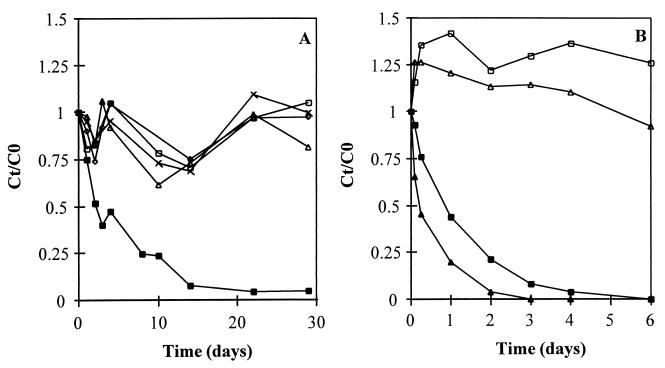
FIG. 2.
(A) CT elimination by autoclaved sludge (243 mg of VSS/batch) from the VFA-fed reactor in the presence of H2O2, given as the concentration at time t divided by the concentration at time zero (Ct/C0). Symbols: ▪, no H2O2; □, 1% (vol/vol) H2O2; ▵, 2% (vol/vol) H2O2; ×, ± 3.5% (vol/vol) H2O2; ◊, 5% (vol/vol) H2O2. The initial CT concentration was 3,900 nmol/batch. (B) CT elimination by autoclaved sludge (296 mg of VSS/batch) from the methanol-fed reactor with (▴) and without (▪) 300 μM Ti(III) citrate. Also shown are the concentrations in blanks with no sludge added with (▵) and without (□) 300 μM Ti(III)citrate. The initial CT concentration was 1,500 nmol/batch.

