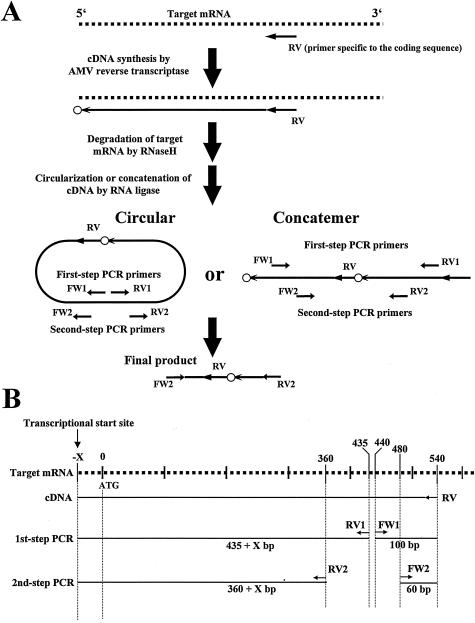
FIG. 1.
Outline chart showing the determination of the transcriptional start sites of the trh1 and trh2 genes by the cRACE method. (A) Schematic representation of the principles of the cRACE method (a slight modification of the method as reported by Maruyama et al. [13]). Oligonucleotide primers for cDNA synthesis and PCR are indicated by short horizontal arrows. Dotted lines and a long arrow represent the target mRNA and the first strand cDNA, respectively. The small open circle represents the nucleotide complementary to the transcriptional start site. (B) Locations of the primers and expected sizes of the first-strand cDNA and amplicons of the PCR. The dotted line and short arrows represent the target mRNA and primers, respectively. The straight lines depict cDNA or amplicons.

