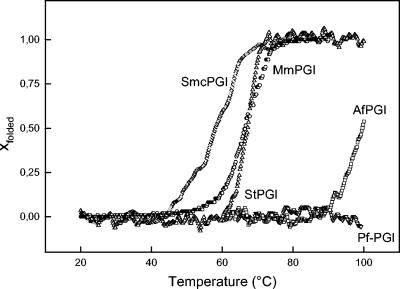
FIG. 3.
Thermal unfolding of cPGIs from P. furiosus, A. fulgidus, M. mazei, S. enterica serovar Typhimurium, and E. meliloti as monitored by CD spectroscopy. The values for PfcPGI (▿), AfcPGI (□), MmcPGI (○), StcPGI (▵), and EmcPGIA (◊) are indicated. Thermal unfolding was either detected at 226 nm (PfcPGI, MmcPGI, StcPGI, and EmcPGIA) or detected at 232 nm (AfcPGI and MmcPGI).

