FIG. 1.
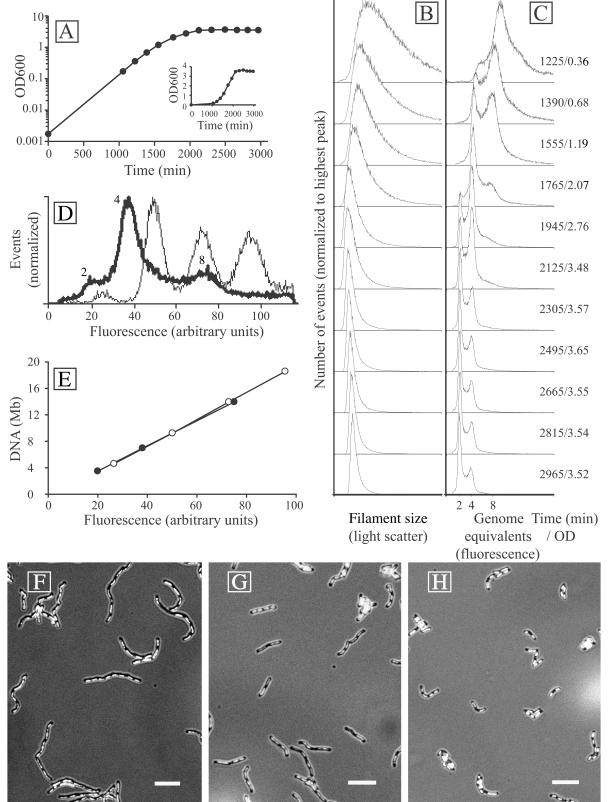
(A) Growth curve of M. thermautotrophicus in batch fermentor culture. The log(OD600) values of bioreactor samples were plotted against time. The insert shows a linear plot of the same data. (B and C) Flow cytometry filament size (light scatter) and DNA content (fluorescence after staining with a combination of ethidium bromide and mithramycin A) distributions in the same culture at different time points. The time (in minutes) after inoculation of the culture and the OD600 (average of four independent samples) are indicated to the right. (D) Superimposed DNA fluorescence peak positions from M. thermautotrophicus (thick line) and E. coli MG1655 seqA::Tn10 treated with rifampin (thin line). The numbers next to the M. thermautotrophicus peaks indicate the deduced numbers of genome equivalents. (E) Peak positions plotted versus chromosome sizes of E. coli (open circles) and M. thermautotrophicus (closed circles) indicate a comparable linear relationship between fluorescence and DNA content for both organisms. (F to H) Epifluorescence micrographs of DAPI-stained M. thermautotrophicus filaments demonstrating that filamentation decreases in a fermentor batch culture over time. Bars, 5 μm. (F) Exponentially growing cells from the 1,390-min time point. (G) Cells from the 1,945-min time point. (H) Stationary-phase cells from the 2,665-min time point.

