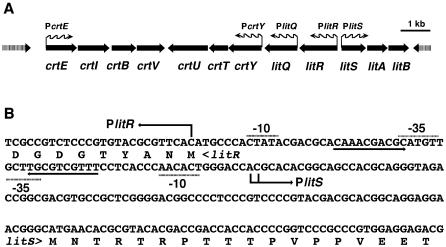
FIG. 2.
Carotenoid biosynthesis gene cluster of S. coelicolor A3(2). (A) Schematic view of crt and the adjacent lit gene cluster. Wavy arrows indicate the orientations of the major transcripts. (B) Nucleotide sequence of the bidirectional promoter region between litR and litS. The N-terminal amino acid sequences of LitR and LitS are also shown. The transcriptional initiation sites determined by S1 mapping are indicated by bent arrows. An inverted repeat region is indicated by convergent arrows. Regions corresponding to the −35 and −10 sites are also indicated.

