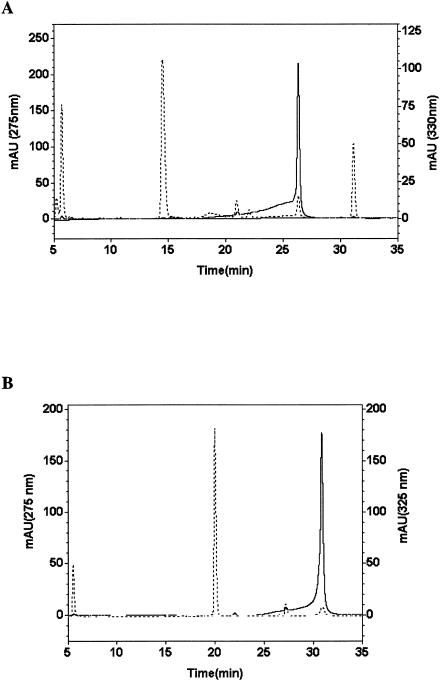
FIG. 5.
Chromatogram of HPLC for direct measurement of product with RebO protein. (A) Analysis of the reaction of L-Trp with RebO. The elution was detected at 275 nm (- - -) and 330 nm (—). (B) Analysis of the reaction of 7-chloro-L-Trp with RebO. The elution was followed at 275 nm (- - -) and 325 nm (—). Experimental conditions are given in Materials and Methods. In vitro reactions were performed with RebO enzyme (1.0 μM). The x axis is the retention time (in minutes), and the y axis is the relative absorbance level (photodiode array detector).

