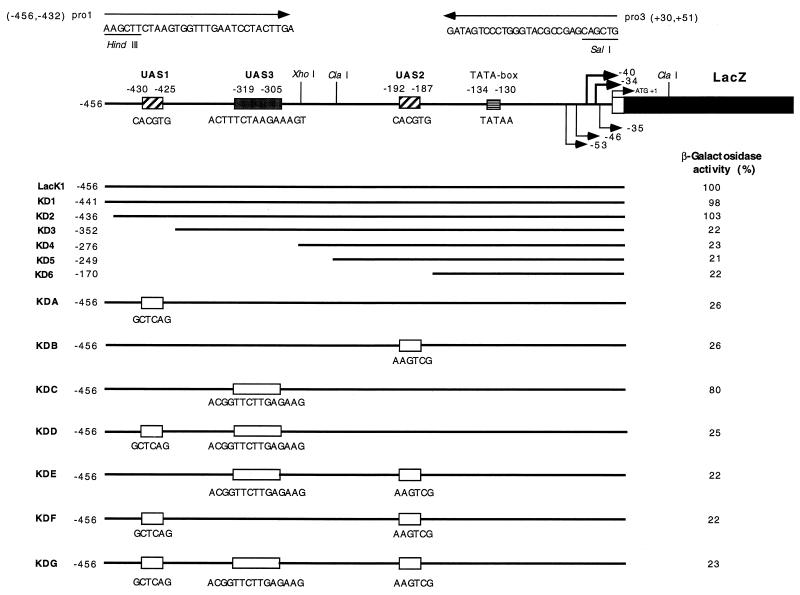
FIG. 3.
The KIPHO5 promoter, deletion analyses, and site-directed mutagenesis derivatives. The restriction map shows 456 bp of the wild-type promoter. mRNA starts are indicated by arrows; the TATA box and ATG are marked. A white box indicates the 16 amino acid signal peptide. The whole sequence has been published previously (12). Insertion of mutated oligomers into UAS1, UAS2, or UAS3 was carried out by PCR (22) with pEFLacK1 as the template and the oligonucleotides shown in the figure. The primers pro1 and pro3 are shown. The names of the plasmids bearing each construction are on the left. The values of β-galactosidase measured under derepression conditions are on the right (see Fig. 2). The residual activities of K. lactis 2359/152F bearing each plasmid is given as a percentage of the activity carried by the control pEFLacK1.

