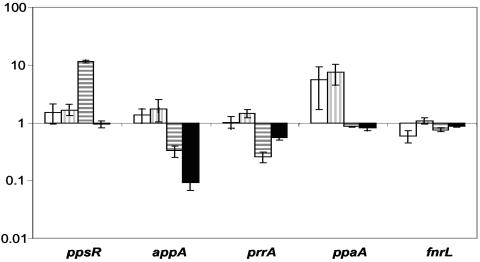
FIG. 7.
Expression changes (plotted as relative changes with a logarithmic scale) of selected regulatory genes controlling PS gene expression as measured by genechips. The expression of every gene in 2.4.1 grown at high (20%) oxygen (data not shown) was assigned a value of 1. White, 2.4.1 grown at low (0.5%) oxygen; vertical stripes, PPS2-4; horizontal stripes, 2.4.1(pPNs); black, APP11.

