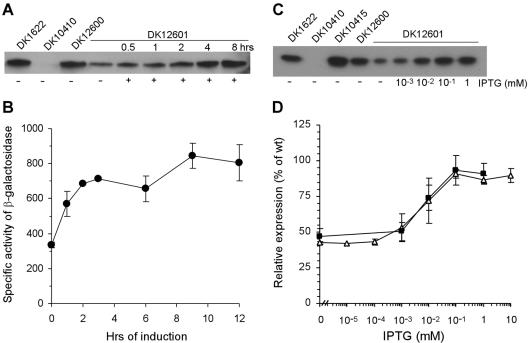
FIG. 3.
Induction of pilin in strain DK12601 grown vegetatively. (A) Immunoblot showing the time course of IPTG-induced expression of pilin from PpilA-lacO-RBS-pilA. Total cell lysates were prepared from 2.5 × 10⁸ cells spotted on 0.5× CTT agar plates with or without 1 mM IPTG, as indicated at the bottom. Aliquots were harvested after incubation at 32°C for 0.5 to 8 h. One microgram of total protein isolated from DK1622 (wild type), DK10410 (ΔpilA), DK12600 (DK10410::PpilA-lacO-RBS-pilA), or DK12601 (DK10410::PpilA-lacO-RBS-pilA, lacI) was loaded in each lane and reacted with anti-PilA antibody. The results are representative of the results of three independent experiments. (B) IPTG induction of PpilA-lacO-RBS-lacZ during growth. Specific activities of β-galactosidase were determined with 2.5 × 10⁸ cells of DK12603 (DK1622::PpilA-lacO-RBS-lacZ, lacI) spotted on 0.5× CTT agar plates with 1 mM IPTG and incubated at 32°C for different times. (C) Immunoblot showing the induction of pilin expression from PpilA-lacO-RBS-pilA as a function of IPTG concentration. Total cell lysates were prepared from 2.5 × 10⁸ cells spotted on 0.5× CTT agar plates with different amounts of IPTG. Aliquots were harvested after incubation at 32°C for 12 h. Then 0.5 μg of total protein isolated from DK1622 (wild type), DK10410 (ΔpilA), DK10415 (ΔpilS), DK12600 (DK10410::PpilA-lacO-RBS-pilA), or DK12601 (DK10410::PpilA-lacO-RBS-pilA lacI) was loaded in each lane and reacted with anti-PilA antibody. The results are representative of the results of three independent experiments. (D) Relative expression of PpilA-lacO-RBS-pilA and PpilA-lacO-RBS-lacZ. Specific activities of β-galactosidase were determined with cells of DK12603 (DK1622::PpilA-lacO-RBS-lacZ lacI) spotted on 0.5× CTT agar plates with different amounts of IPTG and incubated for 12 h at 32°C. The values are expressed relative to the expression of DK12602 (DK1622::PpilA-lacO-RBS-lacZ) (defined as 100%) and are plotted as a function of the IPTG concentration. Each value is the average of the values from two independent experiments, and the error bars indicate standard deviations. The expression of pilin from PpilA-lacO-RBS-pilA in DK12601 in panel C was quantitated by measuring band intensities, and the values are expressed relative to pilin expression in DK1622 and plotted as a function of the IPTG concentration. Each value is the average of the values from three independent experiments, and the error bars indicate standard deviations. Symbols: ▵, β-galactosidase (PpilA-lacO-RBS-lacZ); ▪, pilin (PpilA-lacO-RBS-pilA). wt, wild type.

