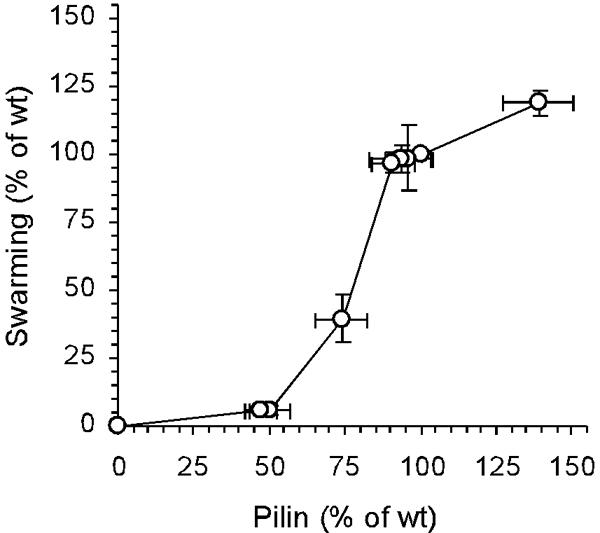
FIG. 6.

Relationship between the amount of pilin synthesized and S motility. The levels of S motility at different IPTG concentrations, as shown in Fig. 5, are plotted as a function of the levels of pilin at the corresponding IPTG concentrations shown in Fig. 3C and D. The values are expressed relative to wild-type S motility and wild-type pilin production. Each value is the average of the values from three independent experiments, and the error bars indicate standard deviations. wt, wild type.
