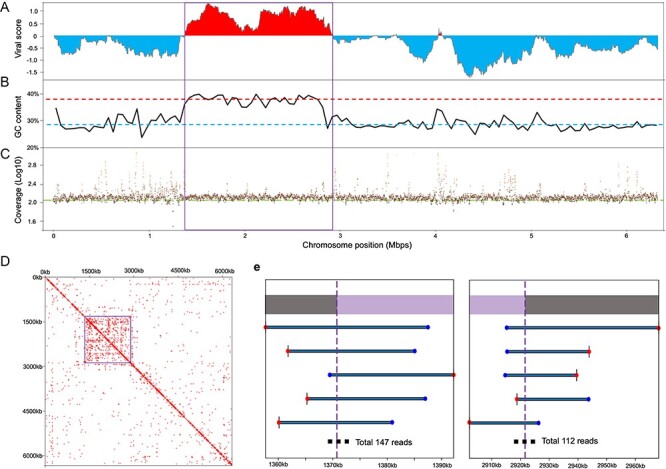
Figure 1.

Details regarding the 1.5 Mb GEVE region of the fungal chromosome. (A) ViralRecall score of chromosome 8 in strain 4401. Viral scores were evaluated with a rolling window of 150 ORFs on the chromosome. The score of each ORF was based on the HMM scores of the viral reference database and cellular reference database. High and low scores represent viral and cellular regions, respectively. (B) GC content along the chromosome. The window size is 50,000 bp. The red and blue dashed lines represent the average GC content of the GEVE region (36.58%) and the remaining parts of chromosome 8 (28.00%), respectively. (C) Average read coverages of the chromosome. Each dot represents the average coverage of 1,000 continuous base pairs. The green line represents the average sequencing depth (bases/genome size = 113×). (D) Heat map showing Hi-C signals of chromosome 8. The resolution is 25 kb. Squares with signal values greater than 1 are marked in red and represent high contact probabilities. (A–D) The viral region is indicated by squares. (E) Examples of long reads connecting the GEVE regions identified by ViralRecall with the remaining parts of the chromosome. We present the five longest representative reads. Blue and red points indicate the start and end of the read, respectively. The extremities of the GEVE region are indicated by purple vertical dashed lines (1,370,742 bp in the figure on the left and 2,921,549 bp in the figure on the right). Purple and gray bars at the top indicate the GEVE and other cellular chromosomal regions, respectively.
