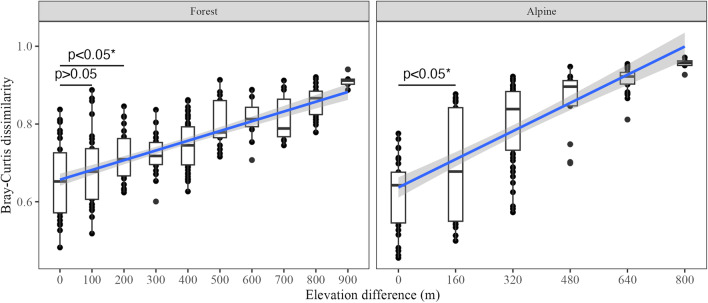
Fig. 5.
Elevation-decay relationship of soil micro-eukaryotic beta diversity in forest and alpine habitats along an elevation gradient on Mt. Asahi, Hokkaido, Japan. Due to the difference in elevational sampling interval, forest and alpine samples were analyzed separately. Blue lines with gray confidence interval show the liner relationship between beta diversity and elevation difference. p values of Tukey’s tests are only showed between the within elevational band dissimilarities and the ones with elevational difference of 100 m and 200 m in forest and 160 m in alpine. Asterisk symbol represents the significant p value (Tukey’s test, p < 0.05)

