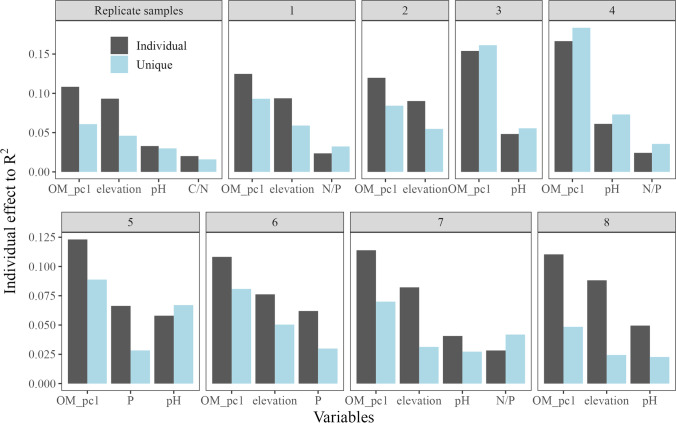
Fig. 7.
Relative contribution of environmental variables to soil micro-eukaryotic beta diversity patterns along an elevation gradient on Mt. Asahi, Hokkaido, Japan. Light blue bars represent unique contribution of the selected variable, and gray bars represent the individual contributions which include the unique and shared effect of the particular variable. In some case, the unique effect can exceed the individual effect due to the negative shared variation in variation partitioning. Numbers of the sub-figure title correspond to the frequency of the combination of parsimonious variables of RDA from 1000 datasets of the transect strategy as 1 being the most frequent, as presented in Table 3

