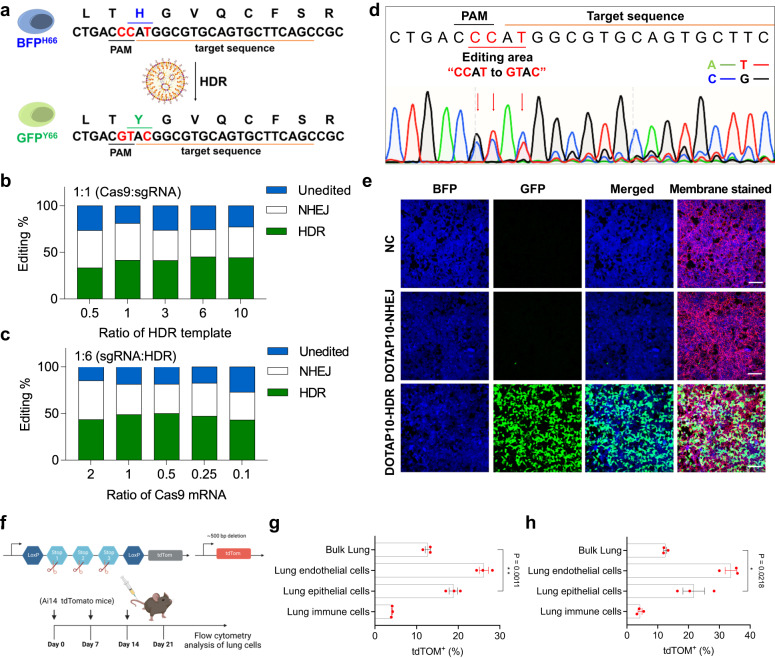
Fig. 3. DOTAP10 LNPs, encapsulating Cas9 mRNA, sgRNA, and ssDNA HDR template, successfully induced HDR in HEK293 cells with Y66H GFP mutation.
a The HEK293 cells have a Y66H mutation in the GFP sequence, which alters the fluorescence from GFP to BFP. Once corrected, the fluorescence will turn back to GFP. The gene editing efficiency was analyzed using TIDER analysis with DNA sequencing data obtained after testing with a series of DOTAP10 LNPs containing Cas9 mRNA, sgRNA, and donor ssDNA template with Cas9:sgRNA weight ratio fixed at 1:1 (b), then with sgRNA:HDR weight ratio fixed at 1:6 (total NA at 0.8 ng μL−1) (c). The optimal weight ratio among Cas9 mRNA, sgRNA and HDR was 0.5/1/6 (named as DOTAP10-HDR). Data of b, c are shown as mean±s.e.m. (n = 3 biologically independent samples). d, DNA sequencing result after treatment of DOTAP10-HDR demonstrated that the editing area was successfully corrected from “CCAT” to “GTAC”. e DOTAP10-HDR efficiently corrected Y66H mutation in HEK293 cells and turned on bright GFP fluorescence. NC group (PBS) and DOTAP10 LNPs encapsulating Cas9 mRNA and sgRNA (named as DOTAP10-NHEJ) group were used as controls. The total NA was fixed at 0.4 ng μL−1. Scale bar: 100 μm. The data was repeated three times independently with similar results. f Ai14 mice were used to evaluate Lung SORT LNP-mediated CRISPR/Cas gene editing in vivo. tdTOM mice were treated once a week with (g) DOTAP40-NHEJ (Cas9 mRNA:sgTOM1 = 2:1) or (h) DOTAP40-HDR (Cas9 mRNA: sgTOM1: HDR template = 2:1:3) formulations with a total NA at 1 mg kg−1 IV. One week following the third injection, mice were sacrificed, and the lungs were collected for flow cytometry analysis to determine the proportion of tdTOM+ cells in different cell types. There is a significant difference in tdTom+ between bulk lung and lung epithelium cell populations with a P value equal to 0.0218 (DOTAP40-HDR). Data are shown as mean ± s.e.m. (n = 3 biologically independent animals). A two-tailed unpaired t-test was used to determine the significance of the comparisons of data (*P < 0.05; **P < 0.01; ***P < 0.001; ****P < 0.0001). Source data of b, c, g, h are provided in Source Data file.

