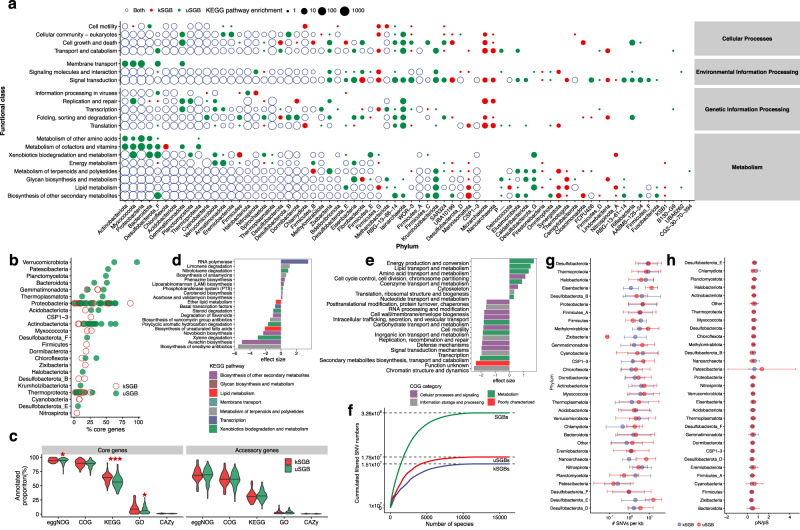
Fig. 3. Functional landscape and intraspecies genomic variation analyses within the soil microbiome.
a Functional category enrichment differential distribution between the kSGBs and uSGBs of the 5184 high-quality MAGs. uSGBs substantially expanded functional landscape of most of phyla in SMAG catalogue. b The abundance of core genes for kSGBs and uSGBs across phyla. c Proportion of core and accessory genes (n = 2,200 species) classified with various annotation schemes. A two-tailed Wilcoxon rank-sum test was performed to compare the classification between the core and accessory genes (*P < 0.05), eggNOG (*P = 0.054), KEGG (***P = 0.0005), GO (*P = 0.041). d Comparison of the KEGG pathways between the core and accessory genes. e Comparison of the COG categories between the core and accessory genes. f Total number of SNVs detected as a function of the number of species, and uSGBs detected more SNVs than kSGBs. g The density of SNVs for kSGBs and uSGBs across dominant phyla (n = 2448 species). h The pN/pS ratios for kSGBs and uSGBs across dominant phyla (n = 2448 species). Data of (g) and (h) are presented as mean values +/− Standard Deviation (SD).

