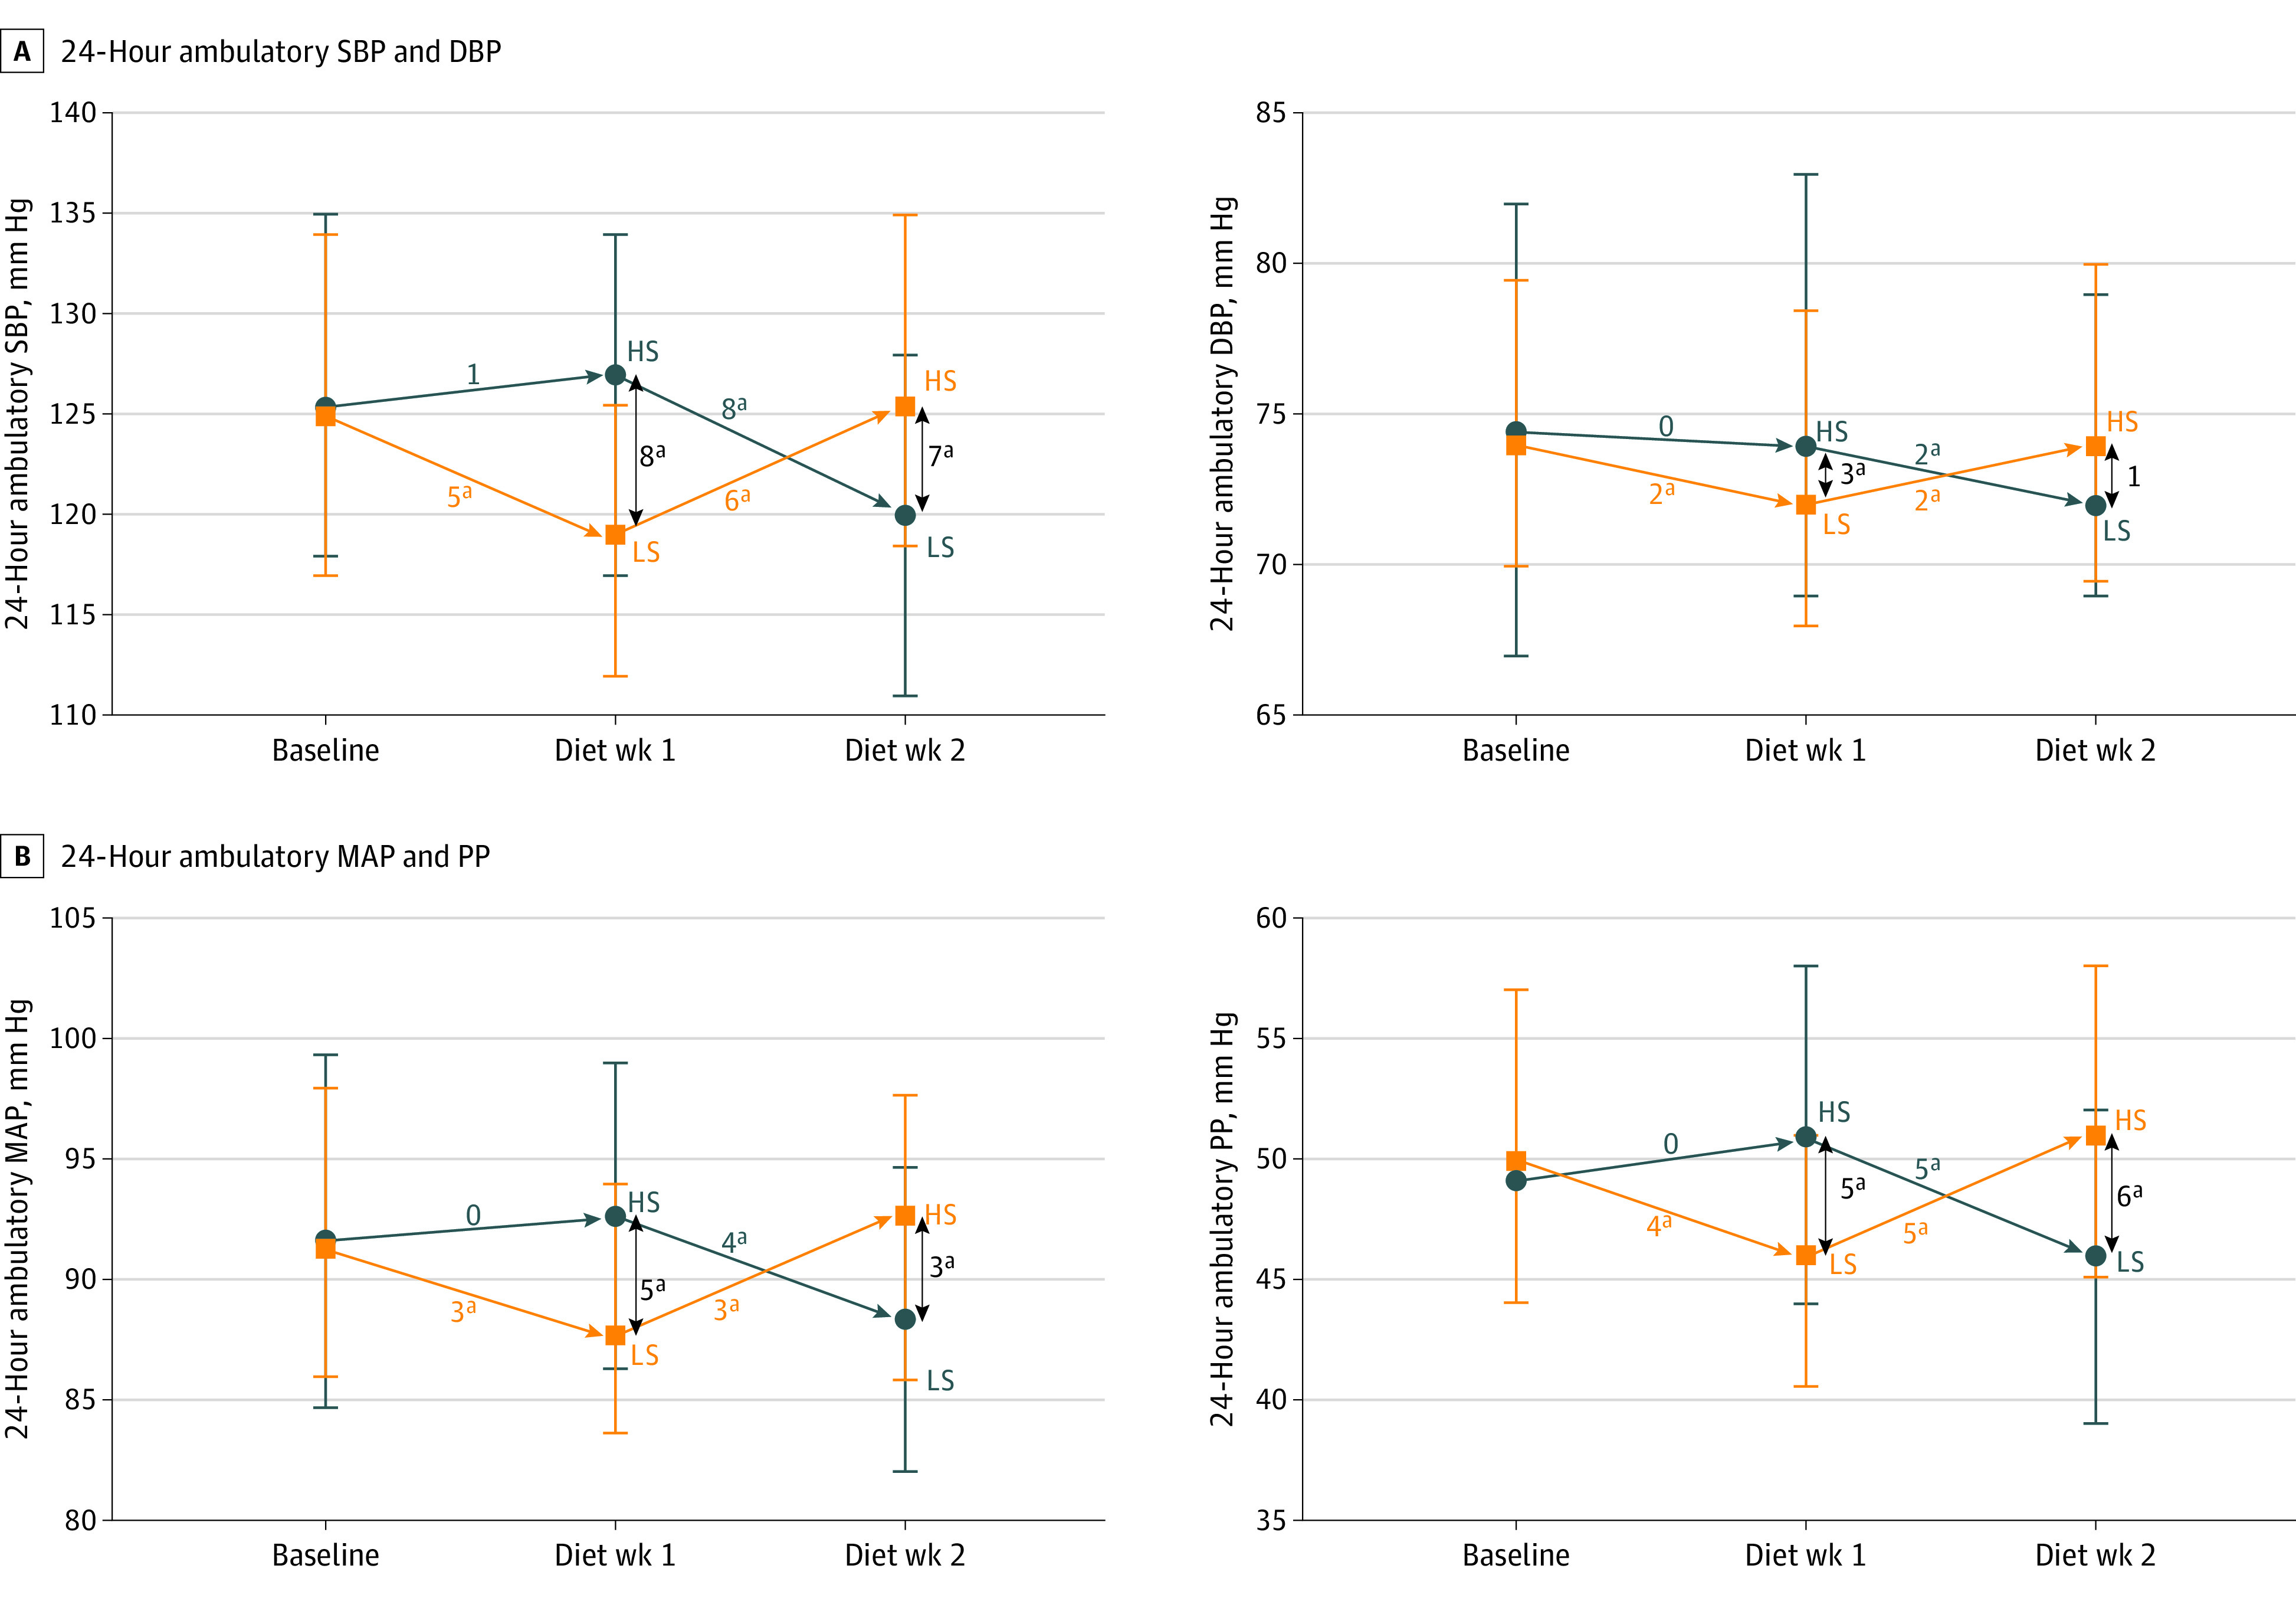
Figure 1. 24-Hour Ambulatory BP According to Allocated Diet Order and Study Visit.

BP indicates blood pressure; DBP, diastolic blood pressure; MAP, mean arterial pressure; PP, pulse pressure; and SBP, systolic blood pressure. Delta values in blue or orange reflect median within-individual differences between diets, while delta values in black are mean differences between the high-sodium (HS) and low-sodium (LS) diet groups. Orange squares are median group values for each time point in those allocated to an LS diet first. Blue circles are median group values for each time point in those allocated to an HS diet first. Vertical bars indicate interquartile range. Between the groups randomized to an HS diet vs an LS diet first, at the end of the first diet week, mean differences in BP were as follows: SBP, 8 mm Hg (95% CI, 4-11 mm Hg; P < .001), DBP, 3 mm Hg (95% CI, 1-5 mm Hg; P = .01), MAP, 5 mm Hg (95% CI, 2-7 mm Hg; P = .001), and PP, 5 mm Hg (95% CI, 2-7 mm Hg; P = .001).
aStatistically significant change.
