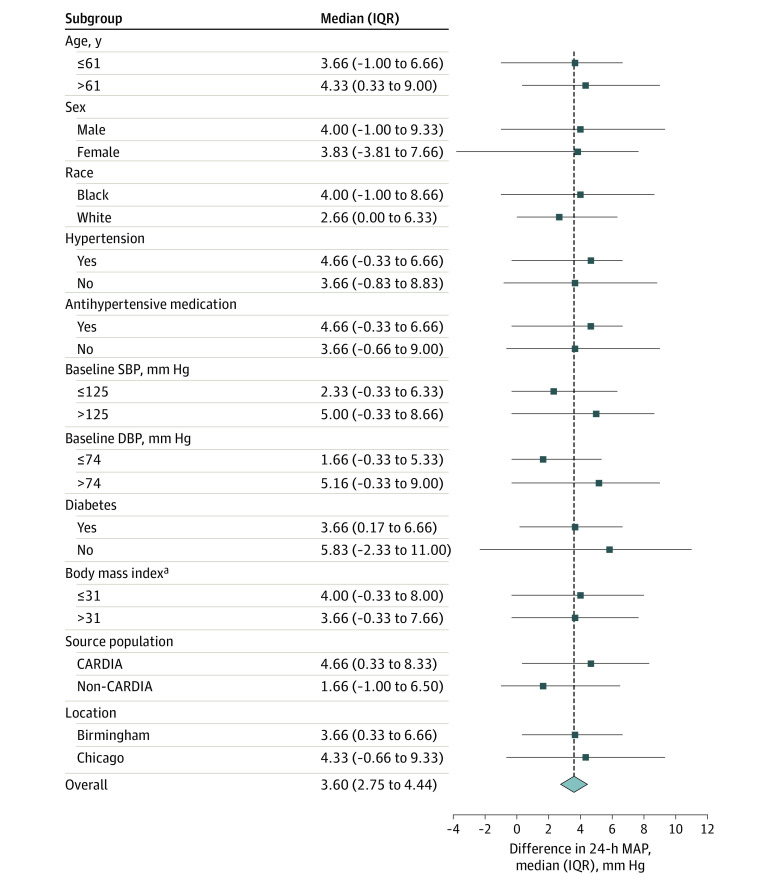
Figure 3. Variation in Salt Sensitivity of Blood Pressure for MAP Across Subgroups.
DBP indicates diastolic blood pressure; MAP, mean arterial pressure; and SBP, systolic blood pressure. Plot of within-individual salt sensitivity of blood pressure, calculated as the difference in MAP between high- and low-sodium diets. For each of the subgroups shown, the within-individual difference in MAP was significant at P < .001 for all except for non-CARDIA participants (P = .003) based on Wilcoxon signed rank tests with post hoc Bonferroni-corrected threshold for significance of P < .002. For each of the subgroup comparisons, eg, male vs female, the Wilcoxon rank sum tests were nonsignificant (P ≥ .10) for all except by DBP (P = .04).
aCalculated as weight in kilograms divided by height in meters squared.

