
Figure 2: Flow cytometry analysis of PTH(1–34)-FAM binding to HEK293S cells expressing PTH1R.
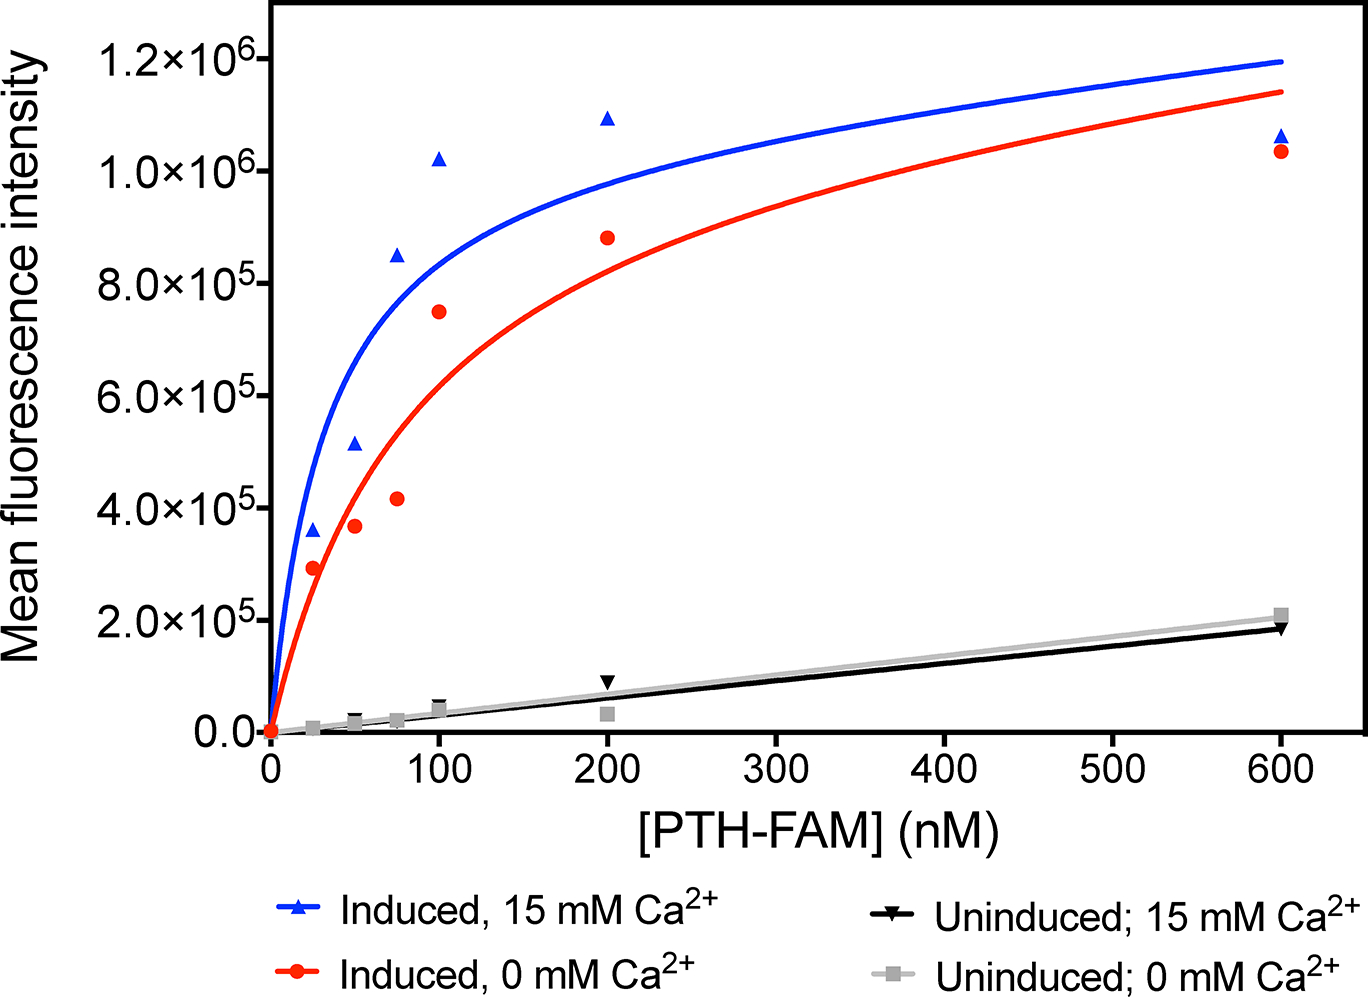
Titrations of HEK293S cells expressing PTH1R with PTH(1–34)-FAM in the presence of 0 mM Ca2+ (red) and 15 mM Ca2+ (blue) and HEK293S cells with no induced PTH1R expression in the presence of 0 mM Ca2+ (grey) and 15 mM Ca2+ (black). Data shown are representative curves from of one of five replicates (SI Figure S3).