
Figure 3.
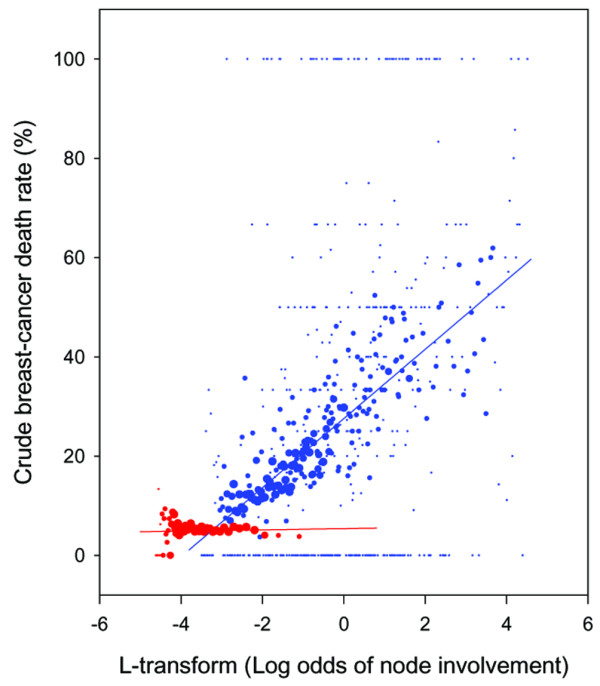
Unadjusted breast cancer mortality as a function of the estimated log odds of nodal involvement in T1–T2 breast cancer. Red dots are node-negative patients, and blue are node-positive patients. The smallest dots represent 1–20 patients and the largest dots represent >200 patients. The straight lines highlight the different slopes but should not be interpreted as the basis for extrapolation (they would extrapolate to <0% or >100% mortalities).