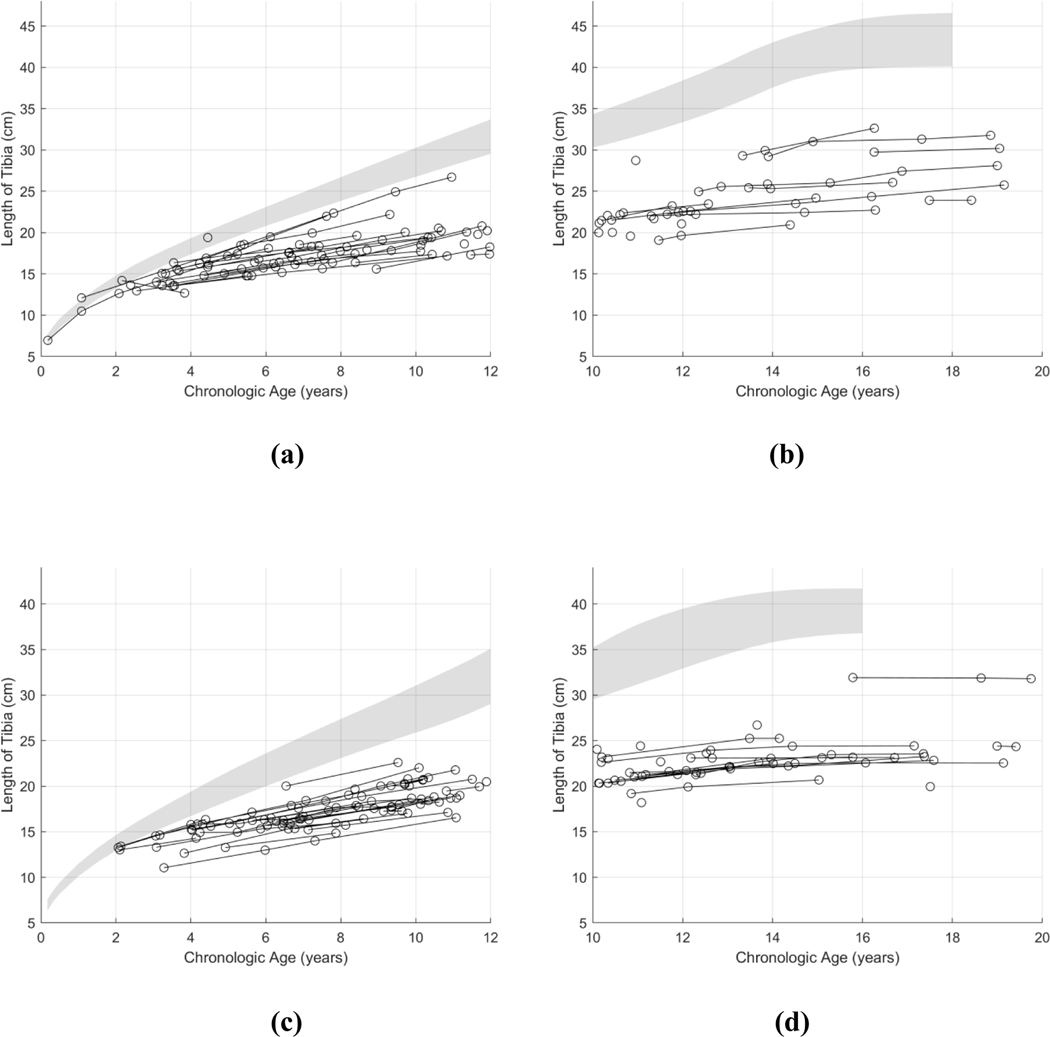
Fig. 4.
Longitudinal growth patterns of the tibia in patients with Progeria. The tibia growth curves of 38 boys ≤12 years old (a), 23 boys ≥10 years old (b), 35 girls ≤12 years old (c), and 25 girls ≥10 years old (d) were plotted in comparison to their respective reference growth standards of Maresh [15]. The population variance, shown in gray, denotes the 10–90% range of normal.

