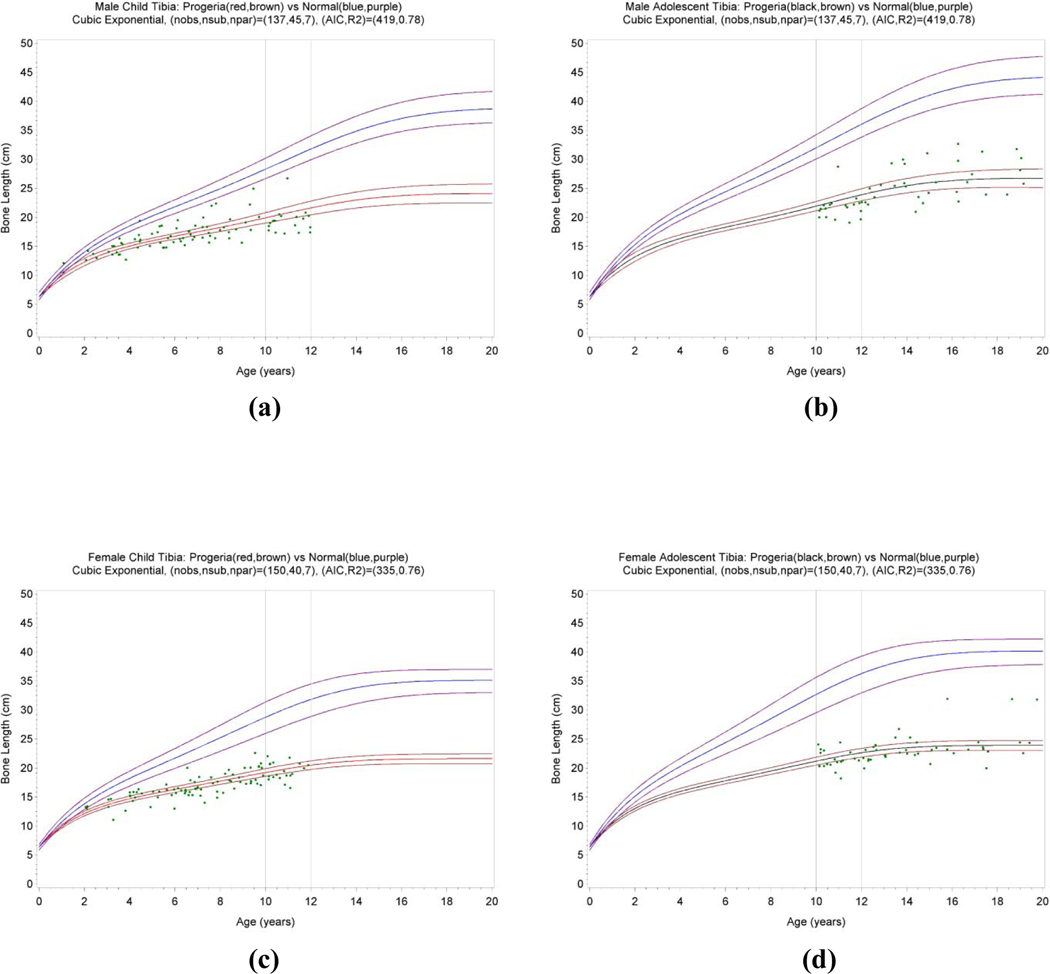
Fig. 5.
Fitted statistical models of the tibia in patients with Progeria. The models for 38 boys ≤12 years old (a), 23 boys ≥10 years old (b), 35 girls ≤12 years old (c), and 25 girls ≥10 years old (d) are plotted in comparison to the normal median (blue line) and range (purple lines).
Measurement data are shown as green dots (88 observations for boys and 93 for girls). In (a) and (b), the Progeria median and its 95% confidence intervals are shown as red and brown lines. In (c) and (d), the Progeria model and its 95% confidence intervals were shown as black and brown lines.

