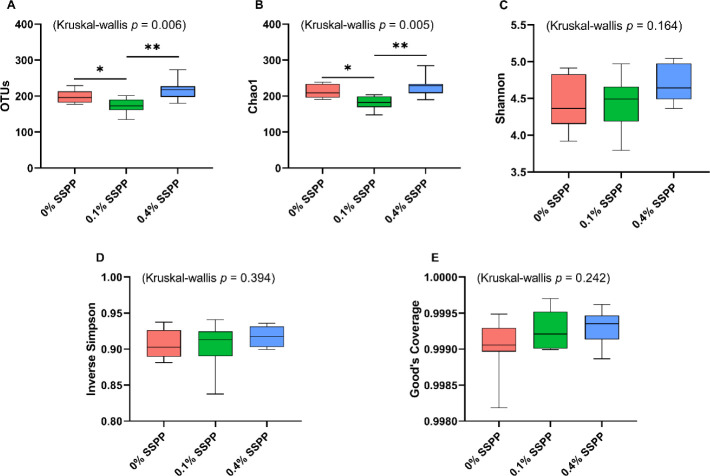
Fig. 1. Box plots representing the distribution of alpha diversity indices OTUs (A), Chao1 (B), Shannon (C), Inverse Simpson (D), and Good’s coverage (E) of broilers’ cecal samples.
Data were analyzed using the Kruskal-Wallis test followed by the Wilcoxon rank sum test (adjusted by the Benjamini-Hochberg method). For each experimental group, the samples represent biological replicates (n = 8). Box plots indicate median values, quartiles as well as whiskers of the distribution of numerical data. Treatments are as follows: 0% SSPP, chicks fed with the basal diet; 0.1% SSPP, chicks fed with the basal diet supplemented with 0.1% of SSPP; 0.4% SSPP, chicks fed with the basal diet supplemented with 0.4% of SSPP. * Indicates significance for the pairwise Wilcoxon rank sum test at p < 0.05. ** Indicates significance for the pairwise Wilcoxon rank sum test at p < 0.01. OTU, operational taxonomic units; SSPP, solubles from shredded, steam-exploded pine particles.

