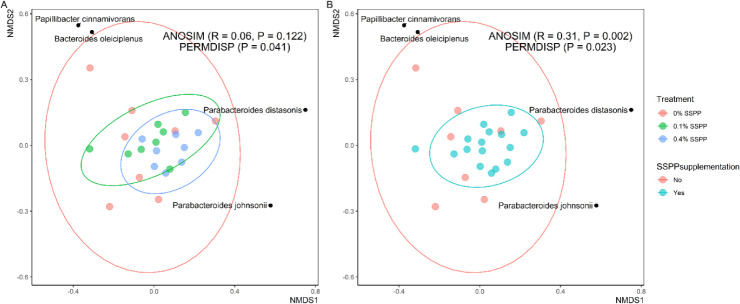
Fig. 2. Non-metric multidimensional scaling (NMDS) plot issued from Bray-Curtis dissimilarity matrix based on relative abundance data of cecal samples.
Colored dots represent cecal samples (biological replicates), while black dots are microbial species. Ellipses indicate 95% confidence intervals of multivariate t-distribution around centroids of the groupings with treatments (A) and SSPP supplementation (B) as factors. PERMDISP (p = 0.041 (A); p = 0.023 (B)) revealed lower individual variation in the SSPP-supplemented group, and ANOSIM (r = 0.31, p = 0.002) indicated SSPP-related clustering. Treatments are as follows: 0% SSPP, chicks fed with the basal diet; 0.1% SSPP, chicks fed with the basal diet supplemented with 0.1% of SSPP; 0.4% SSPP, chicks fed with the basal diet supplemented with 0.4% of SSPP. ANOSIM, analysis of similarities; SSPP, solubles from shredded, steam-exploded pine particles; PERMDISP, permutational multivariate analysis of dispersion.

