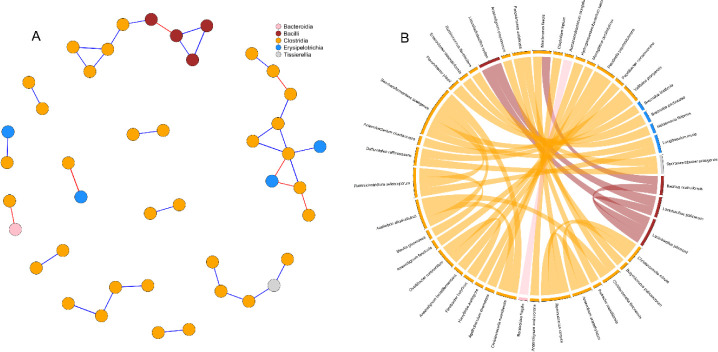
Fig. 6. Network pattern (A) and chord diagram (B) of broilers’ cecal microbiota at the class level.
Both network and chord diagrams network have been drawn based on Spearman’s rank correlation. The significance was set at p < 0.05 and the threshold of correlation was set as | r | = 0.65. In the network (A), the vertexes (circles) correspond to microbial species while the weight of the edges (segments) represents correlations between microbes. Positive correlations are colored in blue while negative correlations are colored in red. In the chord diagram (B), sectors represent the same species described in the network while the thickness of the links is proportional to correlations.

