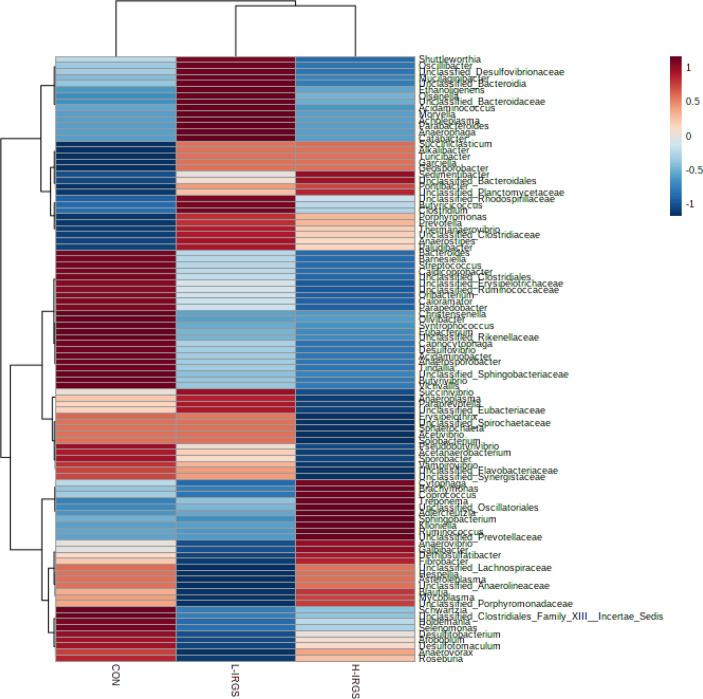
Fig. 3. Hierarchical clustering heatmap of the bacterial genus from the set-up generated in MicrobiomeAnalyst using Bray-Curtis dissimilarity test and Ward clustering algorithm.
Normalized relative abundances are plotted from low (blue), mid (peach), and high (red). (CON, total mixed ration containing 21 % of oat hay; L-IRGS, total mixed ration containing 19% of Italian ryegrass silage; H-IRGS, total mixed ration containing 36% of Italian ryegrass silage).

