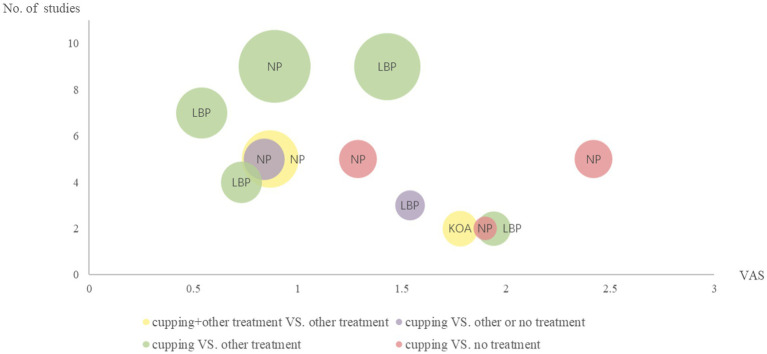
Figure 3.
Evidence mapping of cupping therapy. KOA, knee osteoarthritis; NP, neck pain; LBP, low back pain; VAS, visual analog scale. The size of the bubbles corresponds to the total population’s sample size for the effects of cupping, with bigger bubbles representing a larger sample size. The colors symbolize the different interventions of cupping and non-cupping groups.

