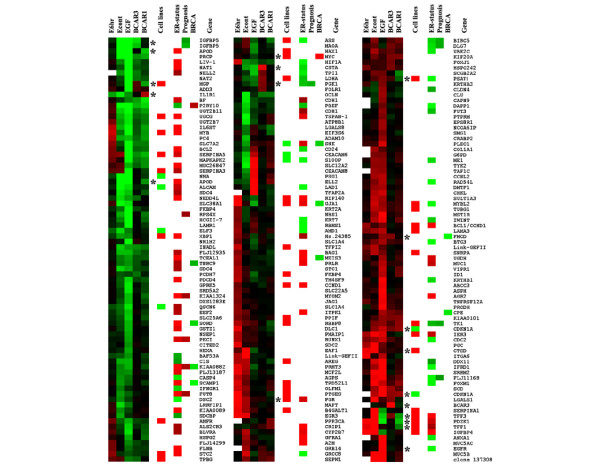
Figure 1.

Expression changes of selected genes in ZR-75-1-derived cell lines, and their relation to reported clinical phenotypes. Average gene expression ratios (log10) in ZR-75-1 cells stimulated with oestrogen for 6 hours (E6hr) or continuously (Econt), of ZR/EGFR cells stimulated with epidermal growth factor for 7 days (EGF), of BCAR1-transfected or BCAR3-transfected ZR-75-1 cells versus unstimulated ZR-75-1 cells are indicated. A selection of 234 sequences was made from the 1006 sequences showing at least once a P value of 0.01 or less and exhibiting at least once a |DE| of more than 1.60. Individual data points of combined swapped and of virtual experiments were only included when either one of the following criteria was met: P < 0.051 or log(error) < 0.1761 or |log(ratio)| > 1.5 × log(error). This procedure eliminates most of the unreliable data points. Genes were hierarchically clustered by using Spotfire. A colour picture was made with TreeView [44]. Increased expression is shown in red and decreased expression is shown in green. Black represents no change and white indicates missing data. In addition, the reported inducing (red) or reducing (green) effects of oestrogen stimulation in cell line models [35–37,39,40] and the correlation (red, positive; green, negative) of individual genes with breast cancer oestrogen receptor (ER) status, BRCA mutation status (BRCA) and prognosis of disease recurrence is indicated [28,41]. Genes investigated with quantitative reverse transcriptase-mediated polymerase chain reaction have been marked with an asterisk. The complete list of 1006 genes with attached information is presented in Additional file 3.
