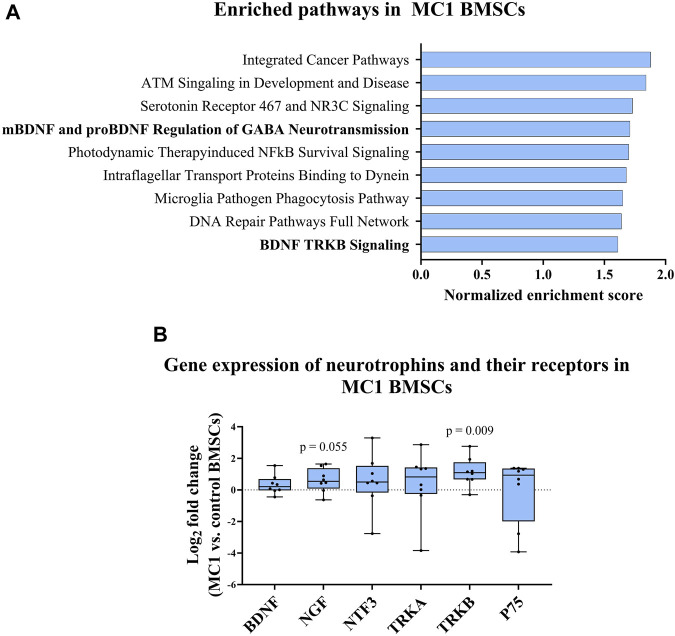
FIGURE 2.
MC1 compared to intra-patient control BMSC neurotrophic gene expression. (A) Gene set enrichment analysis (GSEA) of BMSC bulk RNA sequencing indicated enrichment of BDNF signaling-related pathways in MC1 BMSCs compared to control. (B) Gene expression of neurotrophic cytokines and respective receptors (n = 6 MC1 + 6 intra-patient controls). Significance was tested using the paired t-test of MC1 compared to control log2 fold change values and presented as log2 fold change of MC1 vs. control BMSCs gene expression ± standard deviation.

