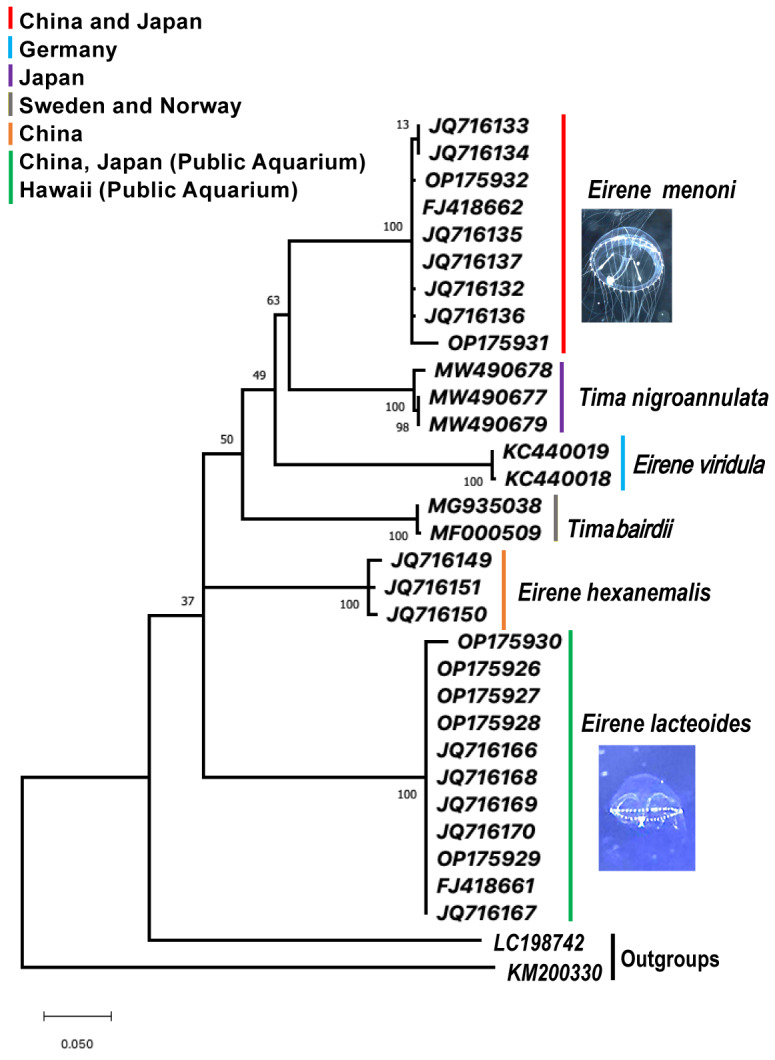
Fig. 6.

Phylogram based on mitochondrial cytochrome c oxidase I gene fragments from 30 hydromedusan ingroup members of the family Eirenidae, with two outgroup taxa. Specimens were collected from the wild and two public Aquaria. The tree was generated with 1000 bootstrap replicates using the maximum-likelihood optimality criterion with the empirically-determined best-fit substitution model. The optimal model selected was TamuraNei, non-uniformity of evolution rates among sites and this was modeled using a discrete Gamma distribution (+G) with 5 rate categories. Under the assumption that a specified fraction of sites is evolutionary invariable (+l), TN93+G+l. This model had 66 parameters, BIC = 6461.115 (Bayesian Information Criterion), AICc = 6461.12 (Akaike Information Criterion, corrected), maximum likelihood score InL = -2907.703, gamma correction (G) = 1.40, and the proportion of invariant sites (l) = 0.49. Clades are color-coded by species and geographic sampling, including the following general regions by bar color: Red = Eirene menoni, field sampled offshore of China and Japan; Purple = Tima nigroannulata field sample offshore of Japan; Blue = Eirene viridula field sampled offshore of Germany; Gray = Eirene bairdii, field collected offshore Norway and Sweden; Orange = Eirene hexanemalis, field collected offshore China; Green = Eirene lacteoides, field collected offshore of China and captive culture Enoshima Aquarium and Waikiki Aquarium. Outgroup taxa are LC198742 = Cassiopea sp. and KM200330 = Alatinaalata (see Table 1).
