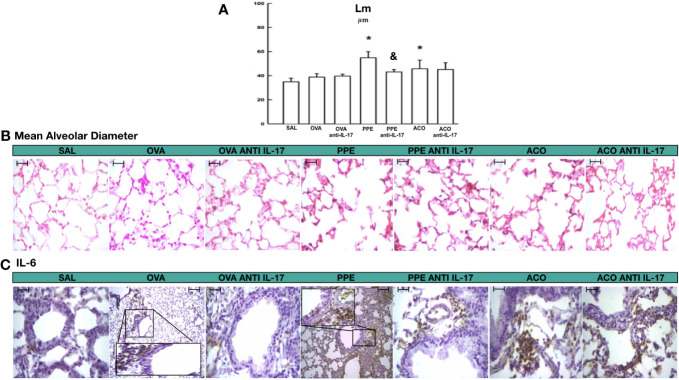
Figure 4.
Results of mean alveolar diameter and qualitative analysis for IL-6. (A) Mean ± standard error of LM evaluation for all experimental groups. Values are presented in micrometers. *p < 0.05, compared to the SAL group; &p < 0.05, compared to the PPE group. (B) Photomicrograph panel showing LM in HE staining (C) and IL-6 in the airway. All figures are presented at a magnification of 400× in the OVA and PPE groups, with scale bars = 40 µm.

