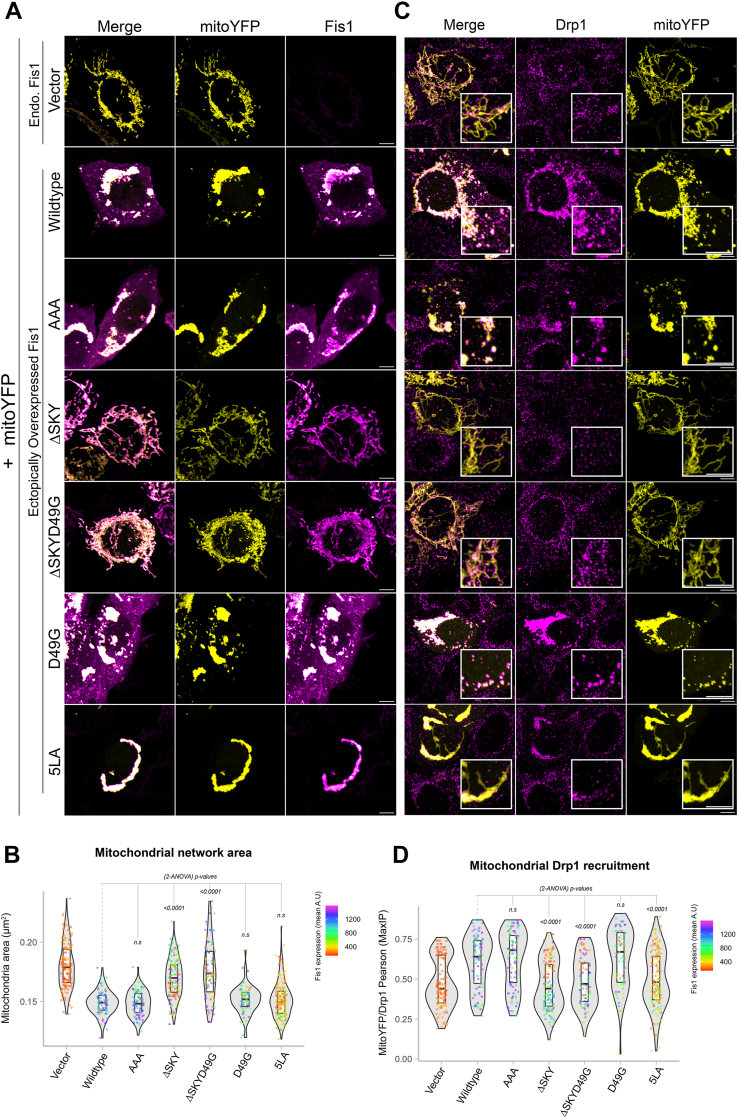
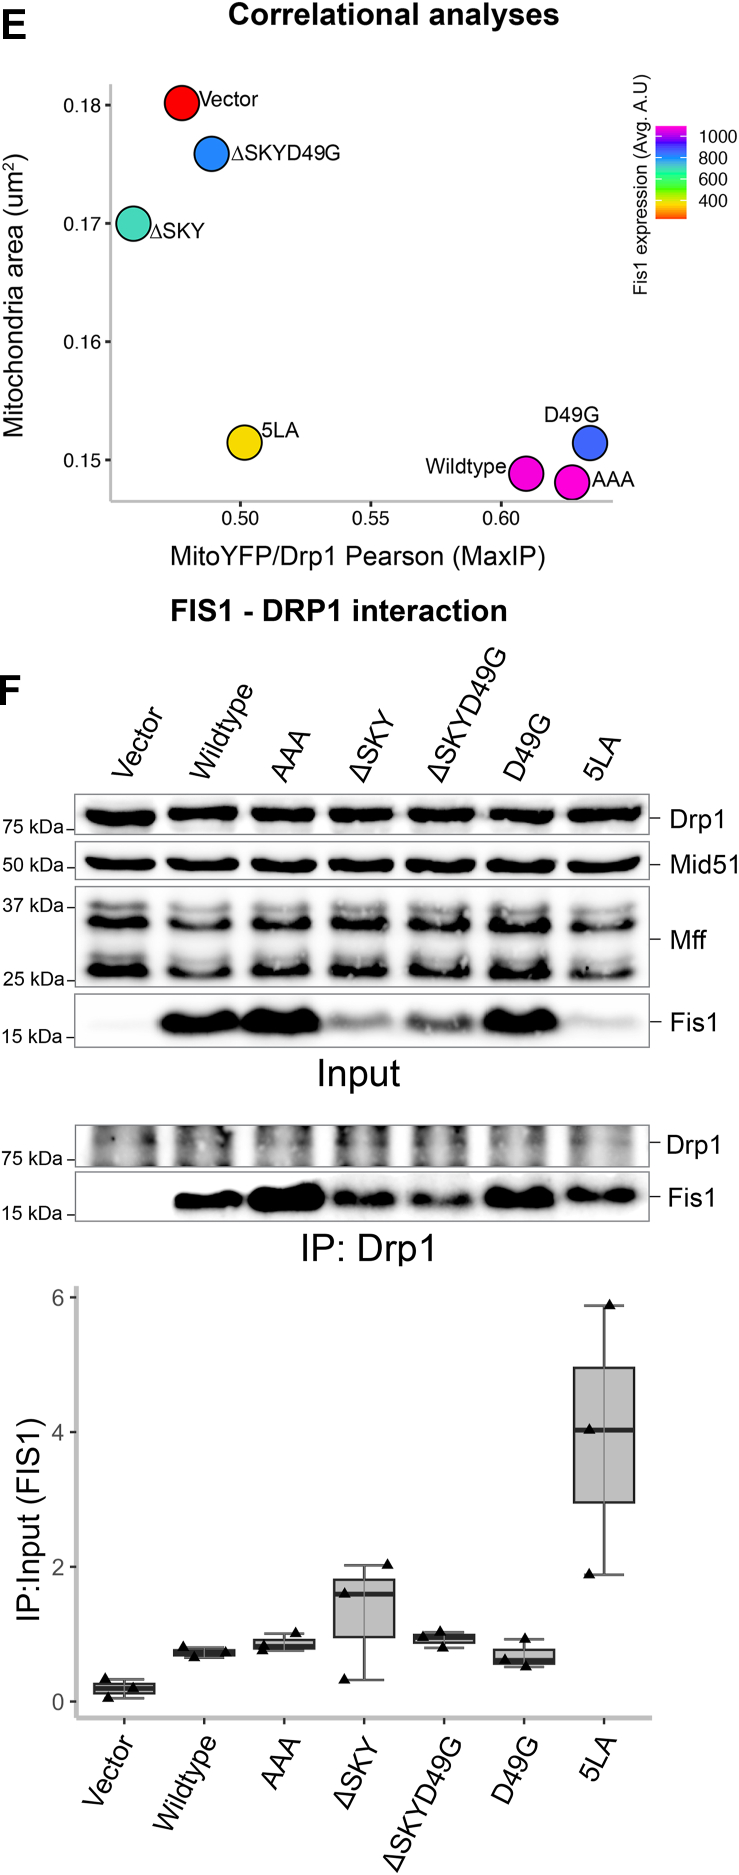
Figure 3.
The SKY insert is required for FIS1-induced changes in mitochondrial morphology. HCT116 cells were transfected with mitoYFP and either pcDNA, pcDNA-FIS1 WT, or pcDNA-FIS1 variants as indicated, fixed, and immunostained sequentially for DRP1, followed by FIS1. A, representative confocal images showing merged anti-FIS1 (magenta-hot) and mitoYFP (yellow) from single channel images as indicated, the scale bar represents 10 μm. B, violin plots of average mitochondrial component area. C, representative confocal images showing merged anti-DRP1 (magenta) and mitoYFP (yellow) from single channel images as indicated. The scale bar represents 10 μm, (magnified scale bar represents 5 μm) with fluorescence intensities adjusted for clarity. D, violin plot of the colocalization between mitoYFP and DRP1 from single cell maximum intensity projections was measured using Pearson’s correlation coefficient. E, correlation plot to determine the relationship between mitochondrial network area and DRP1 recruitment. Each point in B and D represents a single cell and each circle in E represents the population means and are colored based on the FIS1 expression levels determined from mean fluorescence intensity per cell. Data represent three biological replicates with p values calculated from two-way ANOVA analyses followed by TUKEY honest significant differences (HSD). F, Western blots showing the input and DRP1 coimmunoprecipitated fractions harvested from PFA cross-linked cell lysates transfected with pcDNA or pCDNA-FIS1 and variants. The experiment was repeated three times, and FIS1–DRP1 complex formation is quantified on the y-axis as ratios of coimmunoprecipitate and input FIS1 signals. FIS1, fission protein 1; HCT, human colorectal carcinoma; PFA, paraformaldehyde.


