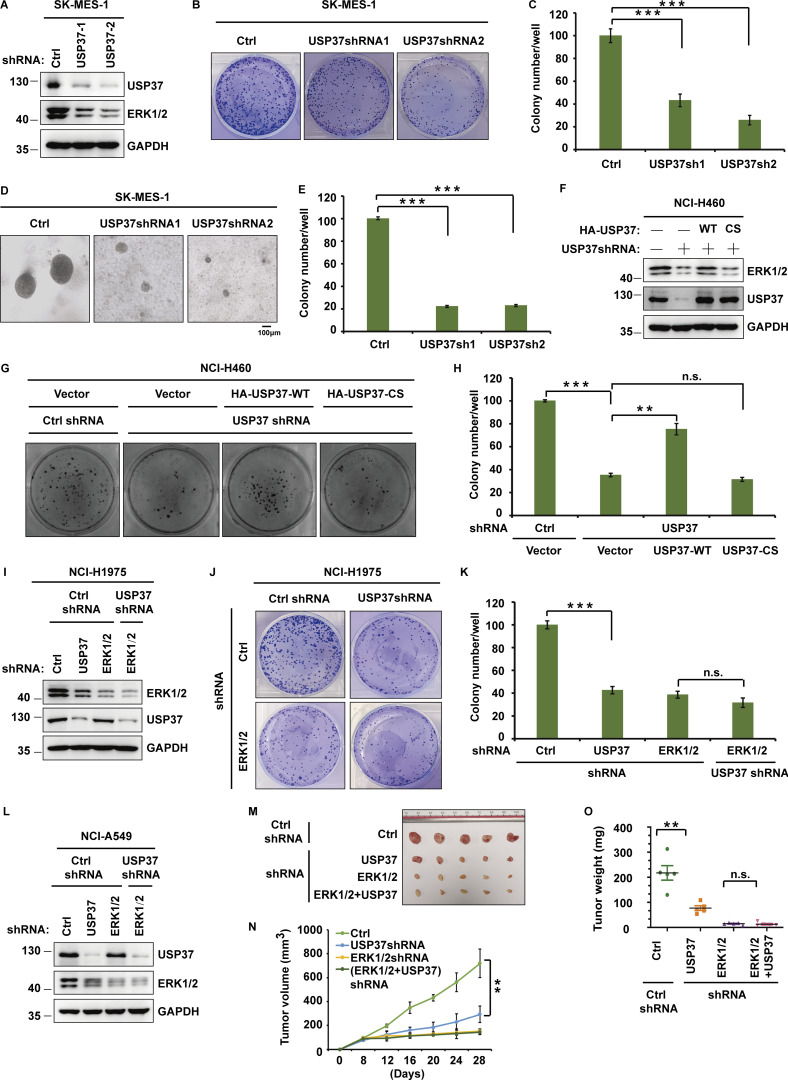
Figure 5.
USP37 regulates cell proliferation and tumor growth through ERK1/2. (A) Cells stably expressing control or USP37 shRNAs were lysed and cell lysates were then blotted with the indicated antibodies. (B) Cells from A were utilized to perform a colony formation assay. (C) Quantitation of the colonies is shown in B. Data were represented as the means ± SD of three independent experiments. Statistical analyses were performed with a two-tailed paired t test. ***P < 0.001 (Control versus USP37sh1), ***P < 0.001 (Control versus USP37sh2). (D) Cells from A were utilized to perform soft agar colony formation assay. Scale bars represent 100 μm. (E) Quantification of the colonies shown in D. Data was represented as the means ± SD of three independent experiments. Statistical analyses were performed with a two-tailed paired t test. ***P < 0.001 (Control versus USP37sh1), ***P < 0.001 (Control versus USP37sh2). (F) Cells stably expressing control or USP37 shRNAs were transfected with the HA-USP37-WT (wild type) or HA-USP37-C350S (catalytically inactive mutant). Cells were lysed and then Western blot was performed with the indicated antibodies. (G) Cells from F were utilized to perform a colony formation assay. (H) Quantitation of the colonies is shown in G. Data were represented as the means ± SD of three independent experiments. Statistical analyses were performed with two-tailed paired t test. **P < 0.01, ***P < 0.001; N.S. stands for no significant change. (I) Cells stably expressing the control shRNA, USP37shRNA, ERK1/2shRNA, or USP37shRNA together with ERK1/2shRNA were lysed, and cell lysates were blotted with the indicated antibodies. (J) Cells from I were utilized to perform a colony formation assay. (K) Quantitation of the colonies is shown in J. Data were represented as the means ± SD of three independent experiments. Statistical analyses were performed with two-tailed paired t test. ***P < 0.001; N.S. stands for no significant change. (L) Cells stably expressing the control shRNA, USP37shRNA, ERK1/2shRNA, or USP37shRNA together with ERK1/2shRNA were lysed, and cell lysates were blotted with the indicated antibodies. (M–O) Cells from L were subcutaneously injected into nude mice (2 × 10⁶ cells). Mice were sacrificed after 4 wk. Tumor images were acquired as shown in M. Tumor volumes (N) and tumor weights (O) were measured. n = 5; data points in N represent mean tumor volume ± SD. Data points in O represent mean tumor weight ± SD. Statistical analyses were performed with a two-tailed unpaired t test. **P <0.01; N.S. stands for no significant change. Source data are available for this figure: SourceData F5.

