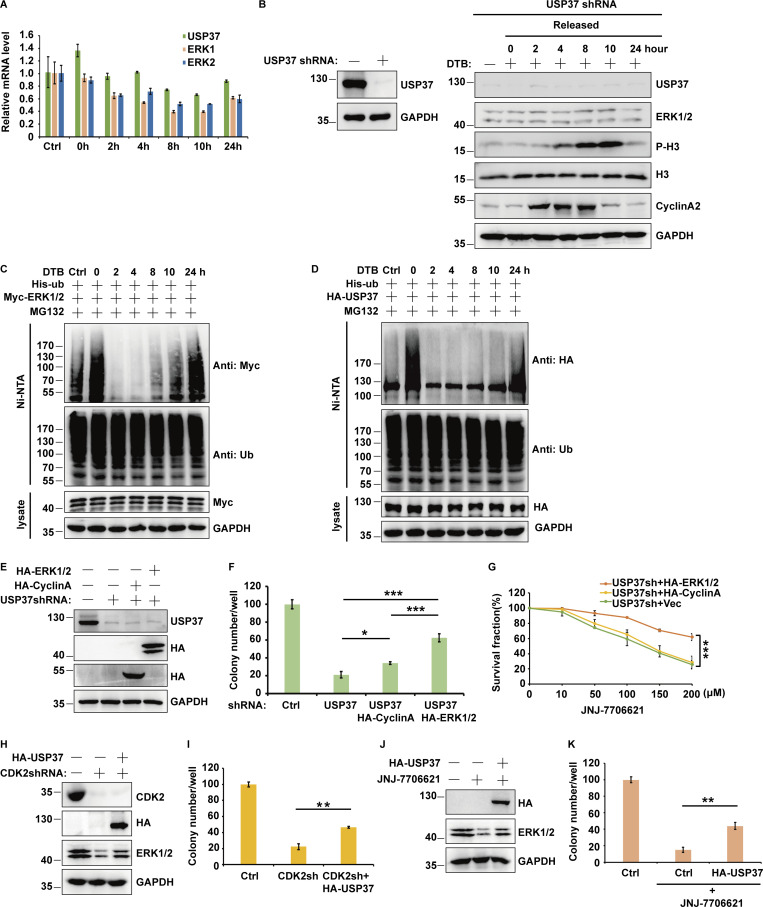
Figure S4.
Related to Fig. 6. CDK2 through USP37 regulates cell growth. (A) The mRNAs were extracted from the rest of the cells from Fig. 6 L, and then subjected to qRT–PCR. β-actin served as an endogenous control. Data was represented as the means ± SD of three independent experiments. (B) Cells stably expressing USP37shRNAs were treated with double thymidine block (DTB) and then released as indicated time points, and then cell lysates were blotted with the indicated antibodies. (C and D) Cell were transfected with the indicated constructs. Cells were treated with double thymidine block (DTB) and then released as indicated time points, and then were treated with MG132 for 12 h before harvested. Covalently modified proteins purified on NiNTA-agarose under denatured conditions. Ubiquitinated ERK1/2 (C) or USP37 (D) was detected by anti-Myc antibody or anti-HA antibody. (E) Cells stably expressing control shRNA or USP37shRNA were transfected with the indicated constructs were lysed, and cell lysates were blotted with the indicated antibodies. (F and G) Cells from E were utilized to perform colony formation (F) or CCK8 assays (G) as indicated. Data were represented as the means ± SD of three independent experiments. Statistical analyses were performed with two-tailed paired t test. *P < 0.05, **P < 0.01, ***P < 0.001. (H) Cells stably expressing control shRNA or CDK2shRNA were transfected with the indicated constructs were lysed, and cell lysates were blotted with the indicated antibodies. (I) Cells from H were utilized to perform colony formation as indicated. Data were represented as the means ± SD of three independent experiments. Statistical analyses were performed with two-tailed paired t test. **P < 0.01. (J) Cells stably expressing control or USP37 and treated with JNJ7706621 were lysed and cell lysates were blotted with the indicated antibodies. (K) Cells from J were utilized to perform colony formation as indicated. Data were represented as the means ± SD of three independent experiments. Statistical analyses were performed with two-tailed paired t test. **P < 0.01. Source data are available for this figure: SourceData FS4.

