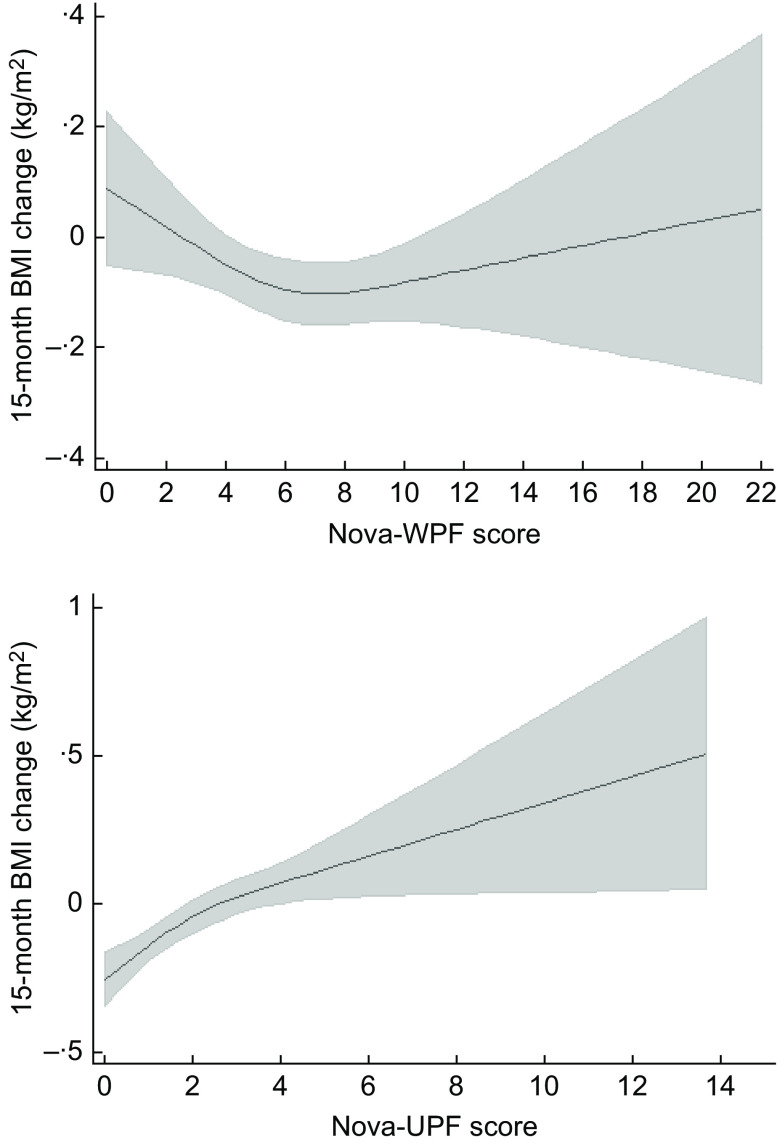
Fig. 1.
The 15-month BMI change (kg/m2) regressed on the baseline Nova-WPF and Nova-UPF scores using adjusted restricted cubic spline linear regression. Participants of the NutriNet-Brasil Cohort study, 2020–2022, (n 9551)a. WPF, whole plant food; UPF, ultra-processed food. aNova-WPF score: Wald test for linear term P < 0·01; Wald test for all non-linear terms P = 0·03; values corresponding to the 10th, 50th and 90th centiles knots were 2·7, 5·7, and 10·0, respectively. Nova-UPF score: Wald test for linear term P < 0·001; Wald test for all non-linear terms P = 0·12; values corresponding to the 10th, 50th and 90th centiles knots were 0·33, 1·67 and 4·0, respectively. Adjustment for sex, age (continuous), macro-region of residence, educational level, baseline smoking status, physical activity, diet for weight loss and BMI (continuous)

