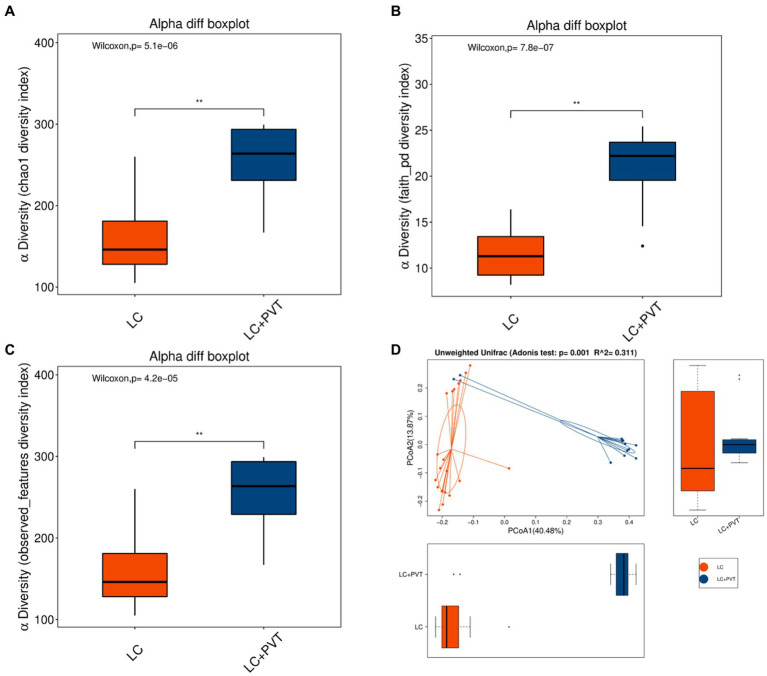
Figure 2.
Gut microbiota alpha and beta diversity indices in LC with PVT and LC controls. The box plots depict differences in microbiome diversity indices between two groups using the (A) Chao1, (B) Phylogenetic Diversity (PD) whole-tree distance index, and (C) Observed species. (D) The level of similarity between the detected gut microbiota communities was assessed via an unweighted analysis of similarity (ANOSIMs).

