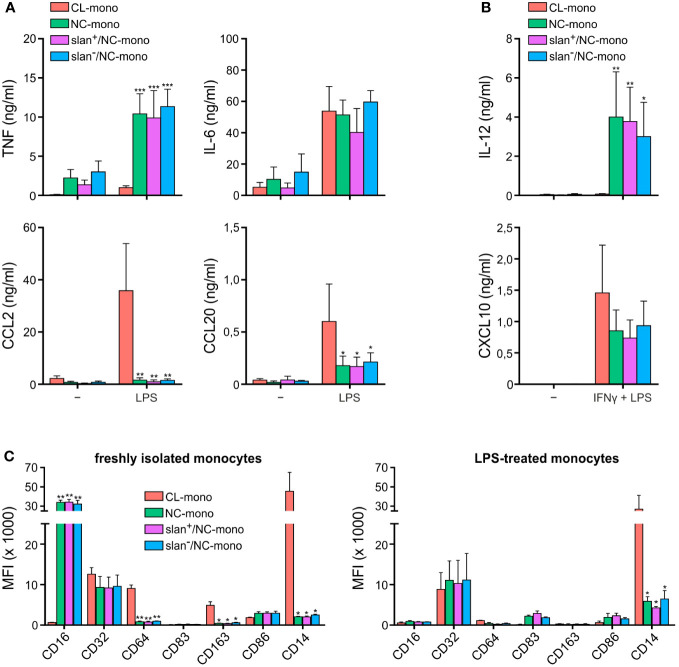
Figure 1.
Cytokine production and antigen expression by CL-, total NC-, slan−/NC- and slan+/NC-monocytes. Production of TNF, IL-6, CCL2 and CCL20 (A), or IL-12 and CXCL10 (B), by CL-, total NC-, slan−/NC- and slan+/NC-monocytes, sorted as depicted in Supplementary Figure 1 and then incubated with either 100 ng/ml LPS for 20 h (A), or pretreated with 200 U/ml IFNγ for 15 h and then incubated with 100 ng/ml LPS for the subsequent 20 h (B). Supernatants were collected, and cytokine/chemokine levels measured by Luminex assays. Results are expressed as the mean values ± SEM (n=4). Asterisks indicate significant differences compared to CL (*P < 0.05, **P < 0.01, ***P < 0.001 by two-way ANOVA corrected for Holm-Sidak’s multiple comparisons test). (C) CL-, total NC-, slan−/NC- and slan+/NC-monocytes either freshly isolated (left panel) or incubated with 100 ng/ml LPS for 20 h (right panel) were stained by specific fluorochrome-conjugated antibodies to evaluate CD16, CD32, CD64, CD83, CD163, CD86, and CD14 membrane expression by flow cytometry. Bar plots show the median of the mean fluorescence intensity (MFI) ± SEM (n = 3). Asterisks indicate significant differences compared to CL (*P < 0.05, **P < 0.01,***P < 0.001 by one-way ANOVA followed by Tukey’s post test).

