Figure 2.
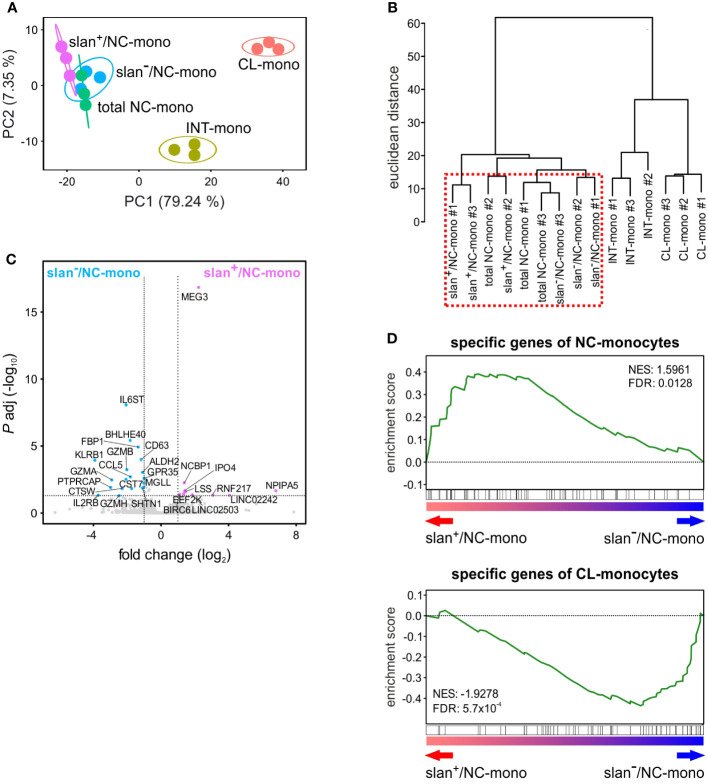
Gene expression profiles obtained by bulk RNA-seq studies of monocyte subgroups. Circulating monocyte subgroups were isolated by the gating strategy shown in Supplementary Figure 1 and subjected to RNA-seq experiments. (A) PCA scatter plot based on the differentially expressed genes (DEGs) identified from bulk RNA-seq analyses of CL- (salmon), INT- (yellow ochre), total NC- (green), slan+/NC- (purple) and slan−/NC- (light blue) monocytes (n = 3). (B) Dendrogram of the unsupervised hierarchical clustering analysis based on DEGs identified from bulk RNA-seq analyses of monocyte subgroups. The red dashed box highlights that total NC-, slan+/NC- and slan−/NC-monocytes display similar transcriptomes. (C) Volcano plot displaying DEGs between slan+/NC- and slan−/NC-monocytes. DEGs more expressed (P < 0.01 and fold change > 2) in slan+/NC- and slan-/NC-monocytes are marked by, respectively, purple and light-blue dots, while genes not significantly different are shown as grey dots. Each dot represents the mean value of three independent experiments. (D) GSEA plots displaying the enrichment score in slan+/NC- and slan−/NC-monocytes of specific genes from CL- (upper plot) and NC- (lower plot) monocytes retrieved from Anbazhagan et al.’s study (22). The false discovery rate (FDR) and normalized enrichment score (NES) were also estimated for each monocyte signature.

