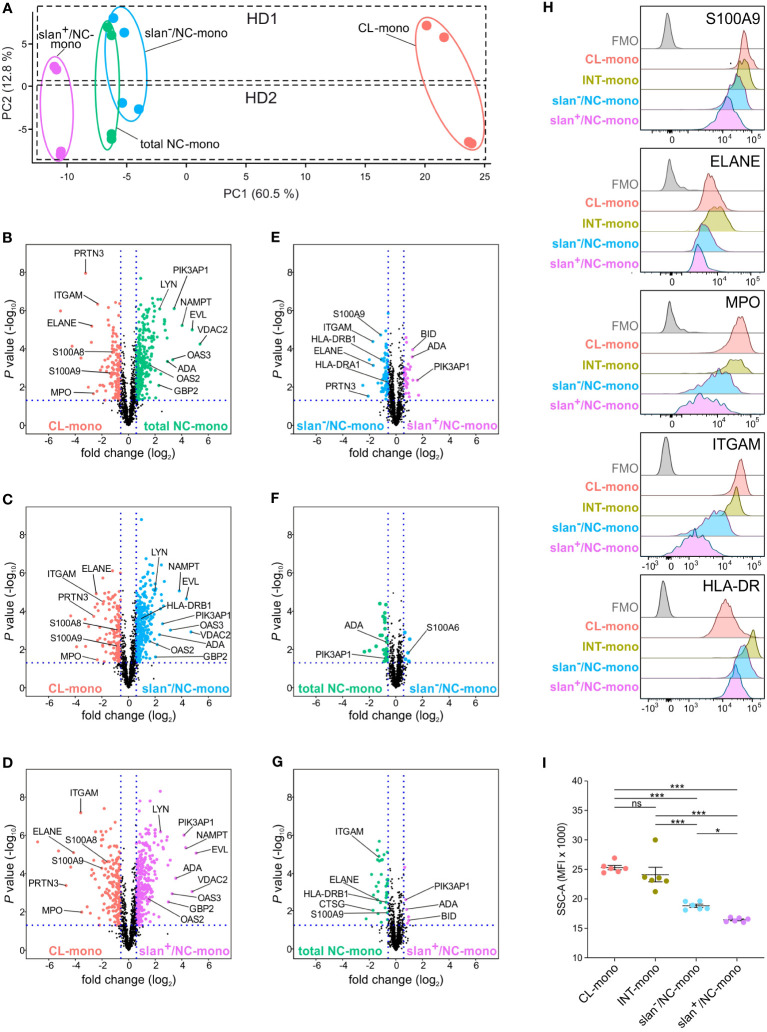
Figure 3.
Proteomic profiles of CL-, total NC-, slan−/NC- and slan+/NC-monocytes. (A) PCA of the LFQ protein intensities obtained from CL- (salmon dots), total NC- (green dots), slan+/NC- (purple dots) and slan−/NC- (light blue dots) monocytes sorted from two healthy donors (HD1 and HD2). Two technical duplicates were performed for each donor, and calculations were made using Perseus software. (B-G) LFQ-based volcano plots showing the differentially expressed proteins in CL-, INT-, total NC-, slan−/NC- and slan+/NC-monocytes. The log2 fold change difference (x-axis) is plotted against the corresponding -log10 of P value (y-axis). Six pair-wise comparisons of proteomes were made: CL- vs NC- (B), CL- vs slan−/NC- (C), CL- vs slan+/NC- (D), slan−/NC- vs slan+/NC- (E) NC- vs slan−/NC- (F) and NC- vs slan+/NC- (G) monocytes. Every dot represents a protein. Differentially expressed proteins (fold change > 1.5, FDR < 0.05 and S0 > 0.1) in CL-, total NC-, slan+/NC- and slan−/NC-monocytes are represented in salmon, green, light blue and purple dots, respectively. (H) CL-, INT-, slan−/NC- and slan+/NC-monocytes were identified by flow cytometry, using CD14, CD16 and slan membrane expression among Lin− HLA-DR+ cells within permeabilized PBMCs. Histograms show the staining of intracellular or membrane expression of S100A9, ELANE, MPO, ITGAM (CD11b) and HLA-DR in monocyte subgroups. FMO (Fluorescence Minus One) control for total PBMC is also displayed. A representative experiment out of 3 is shown. (I) Side scatter (SSC-A) median fluorescence intensity (MFI) of CL-, INT-, slan−/NC- and slan+/NC-monocytes as identified by flow cytometry within PBMCs. Dots show the median of the MFI obtained in every independent experiment (n=6). Means ± SEM are reported. Asterisks indicate significant differences (*P < 0.05, ***P < 0.001 by one-way ANOVA followed by Tukey’s post test).

