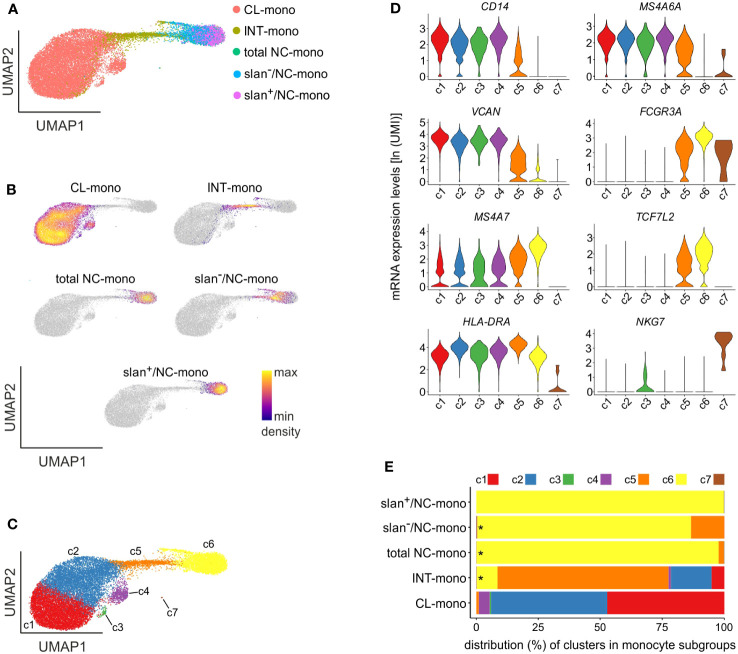
Figure 4.
scRNA-seq experiments of monocyte subgroups. (A) UMAP of scRNA-seq profiles of CL- (salmon), INT- (yellow ochre), total NC- (green), slan−/NC- (light blue) and slan+/NC- (purple) monocytes sorted from the blood of two different HDs. (B) Density plots of CL-, INT-, total NC-, slan−/NC- and slan+/NC-monocytes overlaid on the UMAP of panel (A) Density of cells in each plot refers to the indications of the colored bar. (C) UMAP plot showing 7 clusters (c1-c7) determined by Louvain clustering analysis. (D) Violin plots showing the mRNA expression levels [as ln(UMI)] of genes specific of CL- (CD14, MS4A6A and VCAN), NC- (FCGR3A, MS4A7 and TCF7L2) and INT- (HLA-DRA) monocytes, as well as NK cells (NKG7), across c1-c7 cells. (E) Stacked bar graph shows the relative abundances of c1-c7 cells (indicated as percentages) in CL-, INT-, total/NC-, slan+/NC- and slan−/NC-monocytes. Asterisks indicate the presence of c7 cells. Cluster colors used in panels D, E are the same of those shown in panel C.

